Lecture13. Useful ROS 2 Examples (Sensor Part)
Useful ROS 2 Examples (Sensor Part)
Topic, Service, Action, Gazebo 예시들을 진행하면서 다양한 센서 데이터들을 다루어보았습니다. 이번 시간에는 예시들과 함께 해당 센서 데이터들의 ROS 2 연동 프로그램을 작성해 보겠습니다.
CV2 and ROS 2
다양한 컴퓨터 비전 알고리즘을 담고 있는 오픈소스 비전 라이브러리인 OpenCV를 ROS 2와 연동하여 사용해 봅시다.
cv2 and rclpy
첫번째 시간으로 ROS 2의 이미지 데이터를 OpenCV Python, cv2와 연동하는 방법에 대해 알아보겠습니다.
Image Publish - Python
- 우선, 항상 그렇듯이 예시를 실행해 보겠습니다.
- 온라인상에서 아무 영상 하나를 다운받아 위치를 기억해주세요.
- img_pub.py 코드의 VIDEO_FILE_ROOT 변수를 해당 위치로 변경해줍니다.
# Import the necessary libraries
import rclpy # Python Client Library for ROS 2
from rclpy.node import Node # Handles the creation of nodes
from sensor_msgs.msg import Image # Image is the message type
from cv_bridge import CvBridge # Package to convert between ROS and OpenCV Images
import cv2 # OpenCV library

VIDEO_FILE_ROOT = "/home/kimsooyoung/ros2_ws/rosbag2/img_pub_test.mp4"
- 패키지를 빌드한 뒤, 예시를 실행합니다.
# Terminal 1 - pkg build and run
cbp py_cv_tutorial && source install/local_setup.bash
ros2 run py_cv_tutorial img_pub
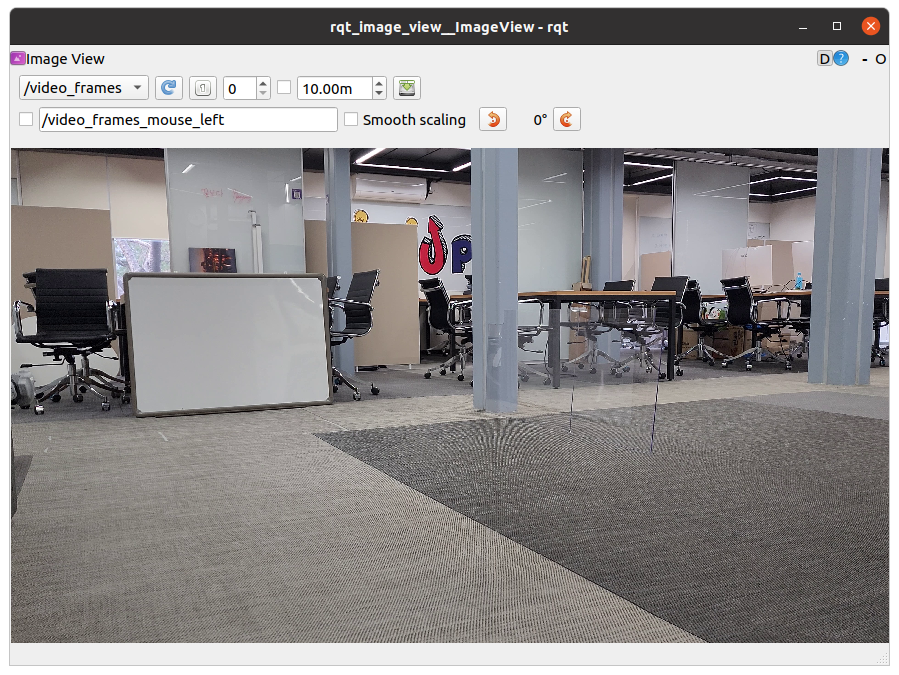
# Terminal 2 - rqt_image_view
ros2 run rqt_image_view rqt_image_view
⇒ rqt image view는 이미지 topic만을 위한 rqt tool로 이미지 데이터를 시각화해줍니다.
코드 분석
- OpenCV에서는 이미지 데이터를 다룰 때 cv::Mat를 사용합니다. 반면 ROS 2는 sensor_msgs/msg/Image를 사용합니다. 따라서 Image <=> Mat 변환을 위해 CV Bridge를 사용합니다.
from cv_bridge import CvBridge # Package to convert between ROS and OpenCV Images
import cv2 # OpenCV library

class ImagePublisher(Node):
    """
    Create an ImagePublisher class, which is a subclass of the Node class.
    """
    def __init__(self):
        ...
        # Used to convert between ROS and OpenCV images
        self.br = CvBridge()

    def timer_callback(self):
        ...
        if ret == True:
            # Publish the image.
            # The 'cv2_to_imgmsg' method converts an OpenCV
            # image to a ROS 2 image message
            self.publisher_.publish(self.br.cv2_to_imgmsg(frame, encoding="bgr8"))
⇒ CvBridge 객체의 imgmsg_to_cv2를 사용하면 손쉽게 Image data로 변환이 가능합니다.
Image Subscribe - Python
일전 학습하였던 rosbag2을 사용하여 예시를 실행해보고자 합니다. 제가 미리 준비한 데이터셋을 제공드리니, 기억하기 쉬운 위치에 다운받아 주세요.
Windows + WSL2 유저의 경우 explorer.exe 명령어를 통해 파일 탐색기를 열 수 있습니다.
- 파일을 적당한 위치에 저장하고 replay 해봅시다.
# 예제 실행 준비
colcon build --packages-select py_cv_tutorial
source install/local_setup.bash

# Terminal 1 – 데이터 위치로 이동하여 ros2 bag 실행
cd <데이터를 저장한 위치>
ros2 bag play quadrupped_train.bag_0.db3

# Terminal 2 – image_view 실행
ros2 run rqt_image_view rqt_image_view
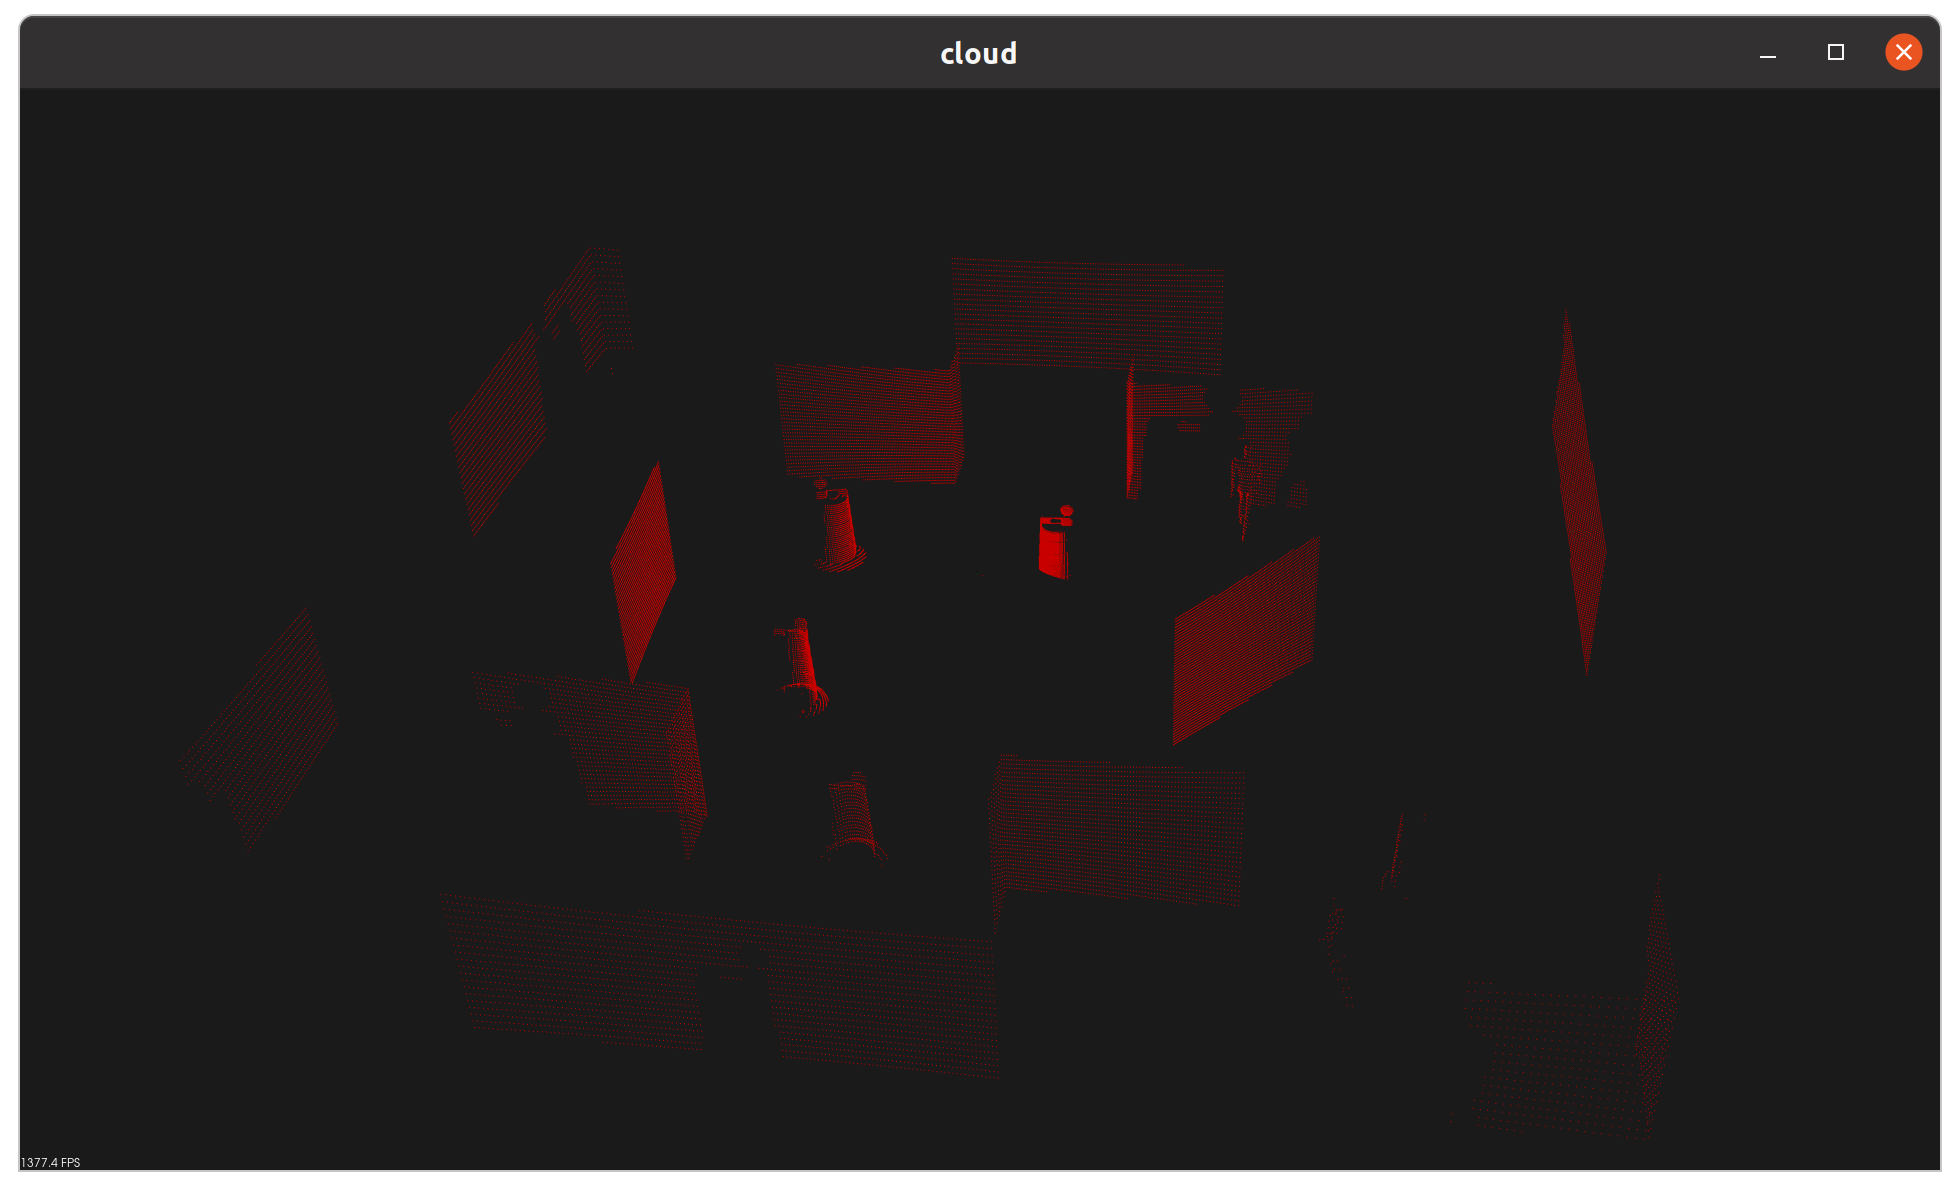
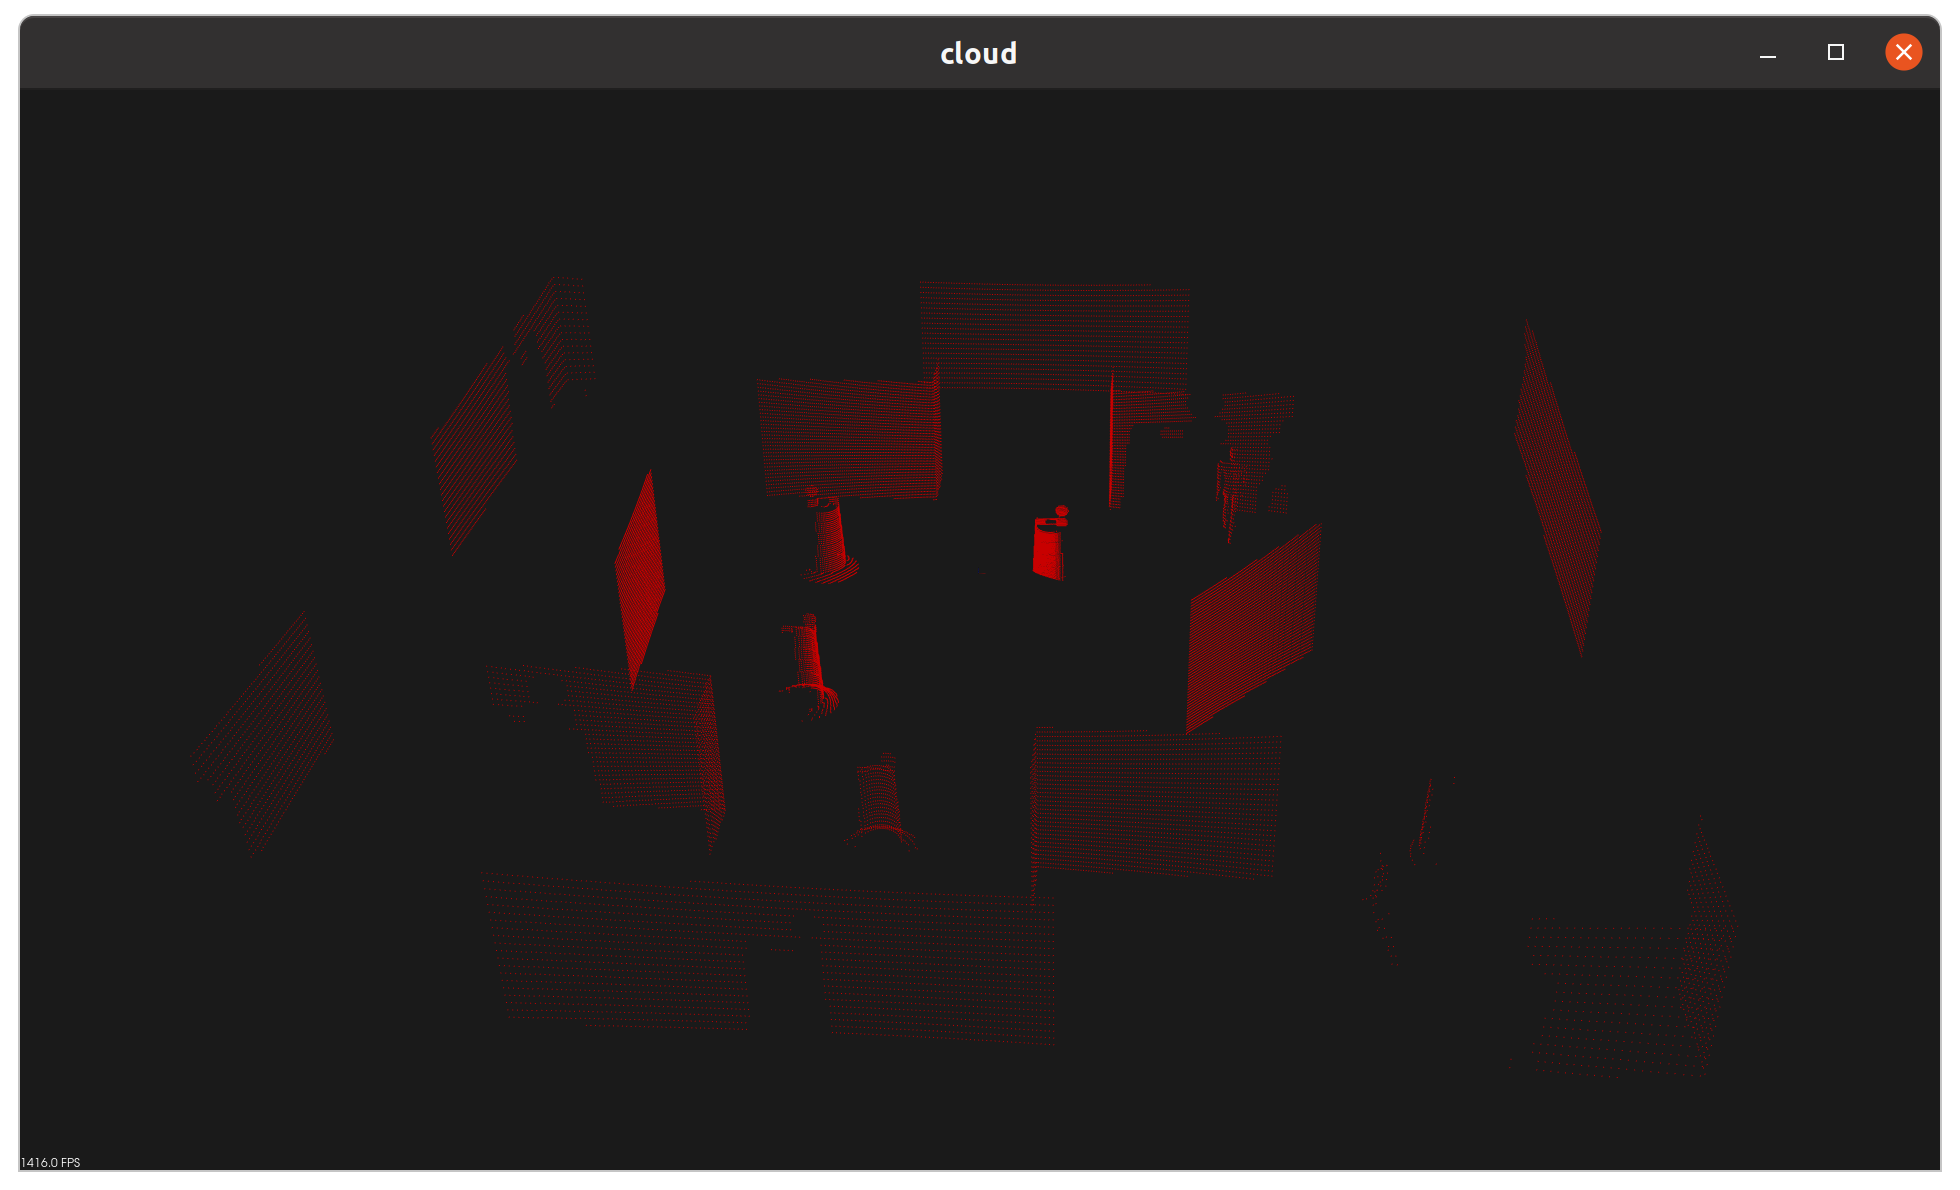
사진과 같이 기차 선로 모습이 보인다면 성공입니다.
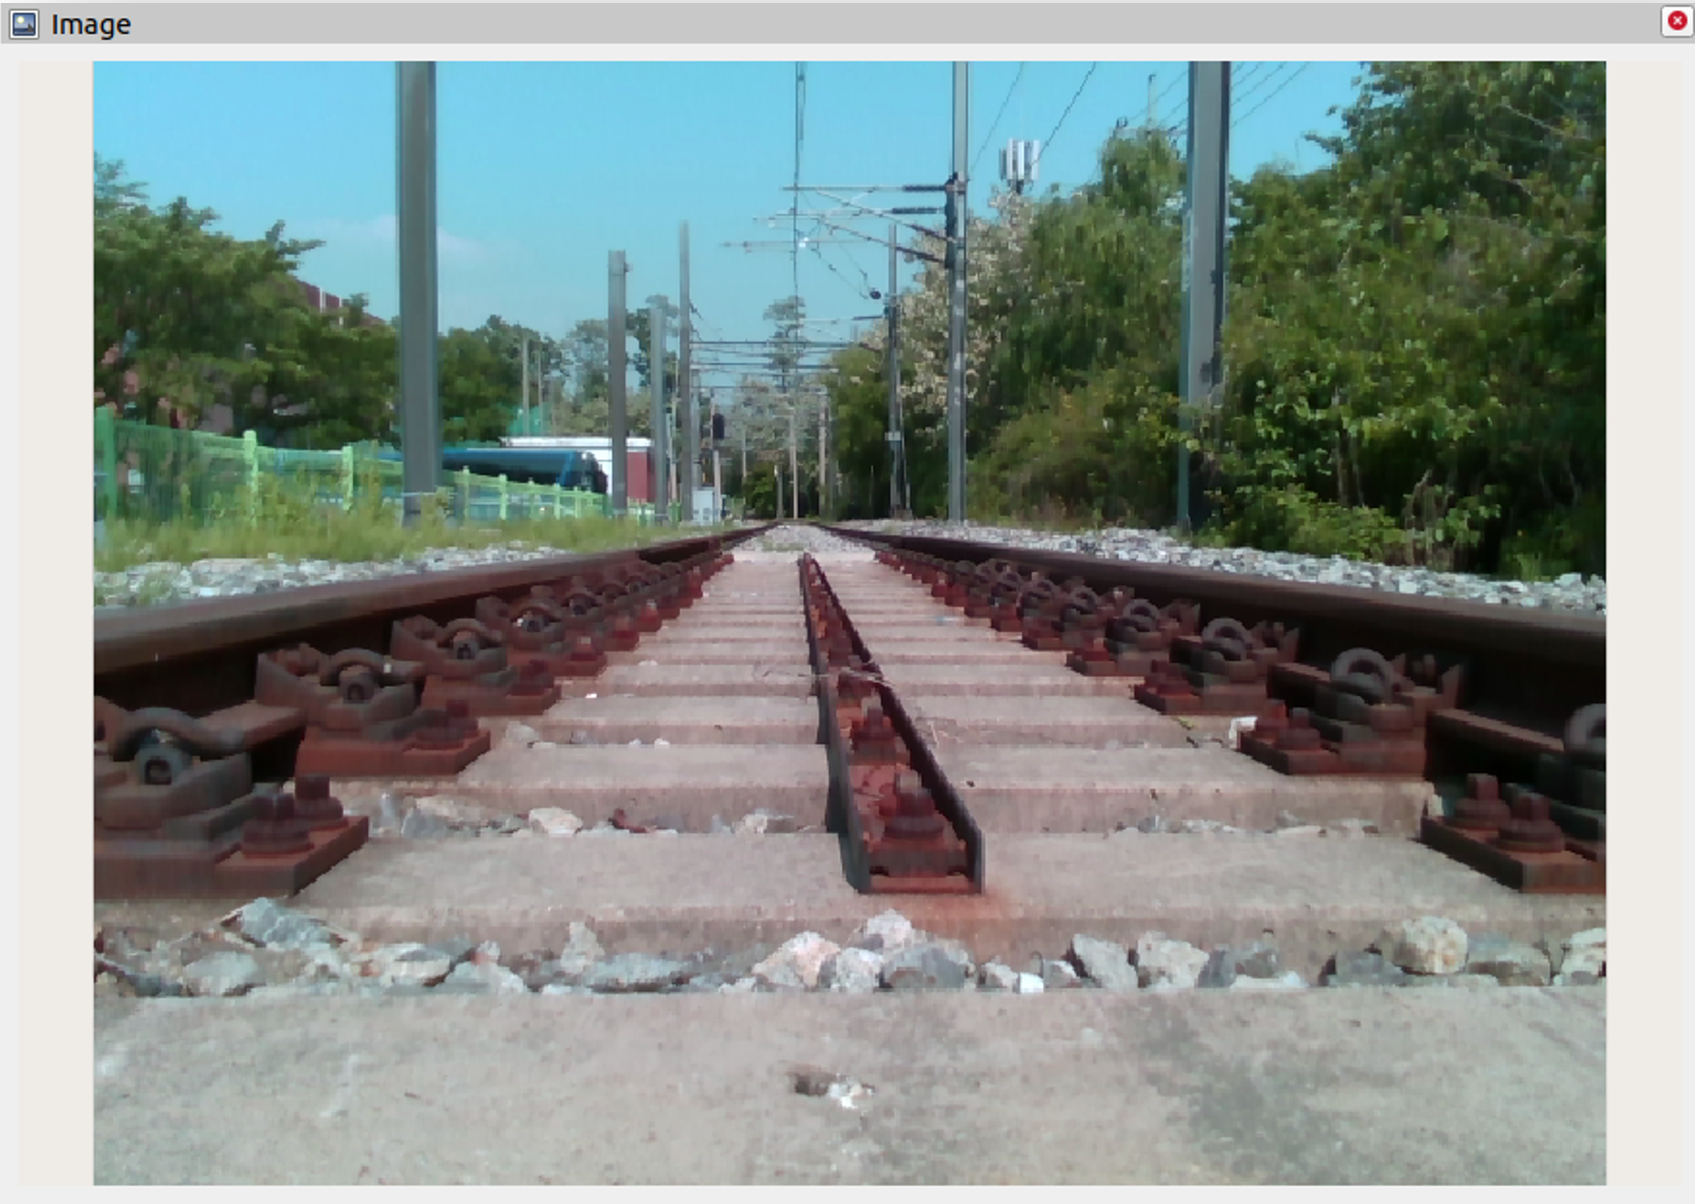
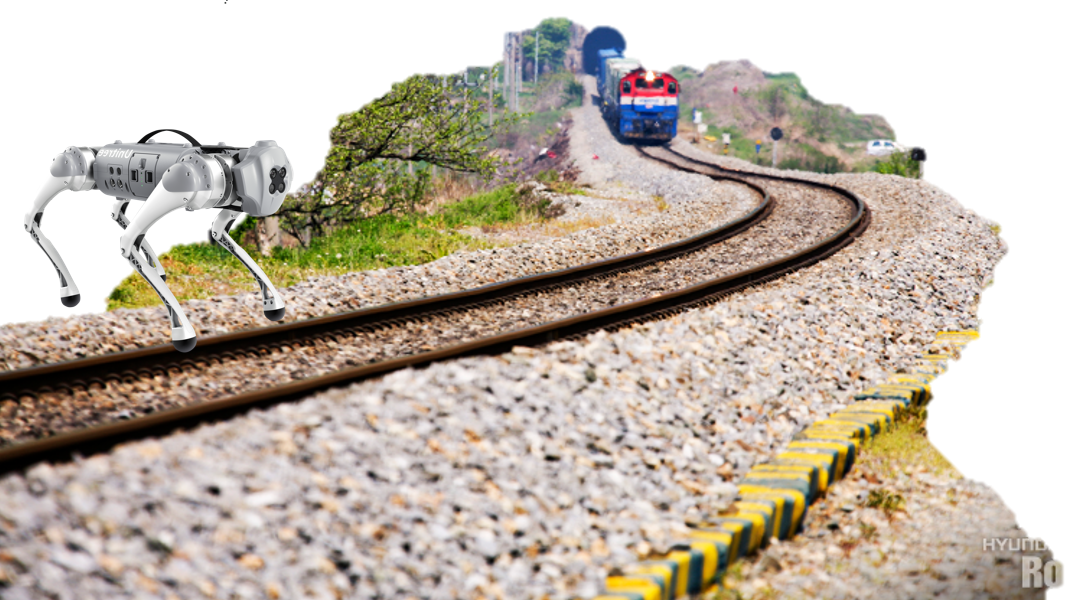
해당 데이터셋은 기차 선로에서 주행하는 4족 보행 로봇으로부터 취득한 것입니다. 기차 선로는 주기적으로 관리가 필요하며, 길고 긴 선로를 로봇이 자동으로 검사해준다면 아주 유용할 것입니다. 이러한 상상을 해보면서 실습에 임해봅시다.
- 다음은 ros2 bag을 재생하면서 생기는 Image topic을 subscribe한 뒤, 이를 cv2.imshow()로 시각화하는 예시입니다.
# Terminal 1
$ cd <bag 파일 위치>
$ ros2 bag play quadruped_train/quadruped_train.bag_0.db3
[INFO] [1667077909.362223100] [rosbag2_storage]: Opened database 'quadrupped_train/quadrupped_train.bag_0.db3' for READ_ONLY.
...

# Terminal 2
$ ros2 run py_cv_tutorial img_sub
[INFO] [1667077909.613586300] [image_subscriber]: Receiving video frame
[INFO] [1667077910.934147000] [image_subscriber]: Receiving video frame
...
- 이번에는 ROS2 msg를 cv데이터 포멧으로 변환해야 하지요? cv_bridge를 통해 imgmsg_to_cv2 함수를 실행하여 이 작업을 수행합니다.
from cv_bridge import CvBridge # Package to convert between ROS and OpenCV Images
import cv2 # OpenCV library

class ImageSubscriber(Node):

    def __init__(self):

        # Used to convert between ROS and OpenCV images
        self.br = CvBridge()
				...

		def listener_callback(self, data):
				...
        # Convert ROS Image message to OpenCV image
        current_frame = self.br.imgmsg_to_cv2(data, "bgr8")
        edge_frame = self.hough_transform(current_frame)
- imgmsg_to_cv2를 통해 CV::Mat으로 변환된 이미지 데이터를 OpenCV의 다양한 기능들과 함께 사용할 수 있습니다. 코드의 imshow 부분을 위와 같이 주석 토글하여 이미지 처리를 적용해 봅시다. 예시를 위해 직선검출 알고리즘을 사용해 보았습니다.
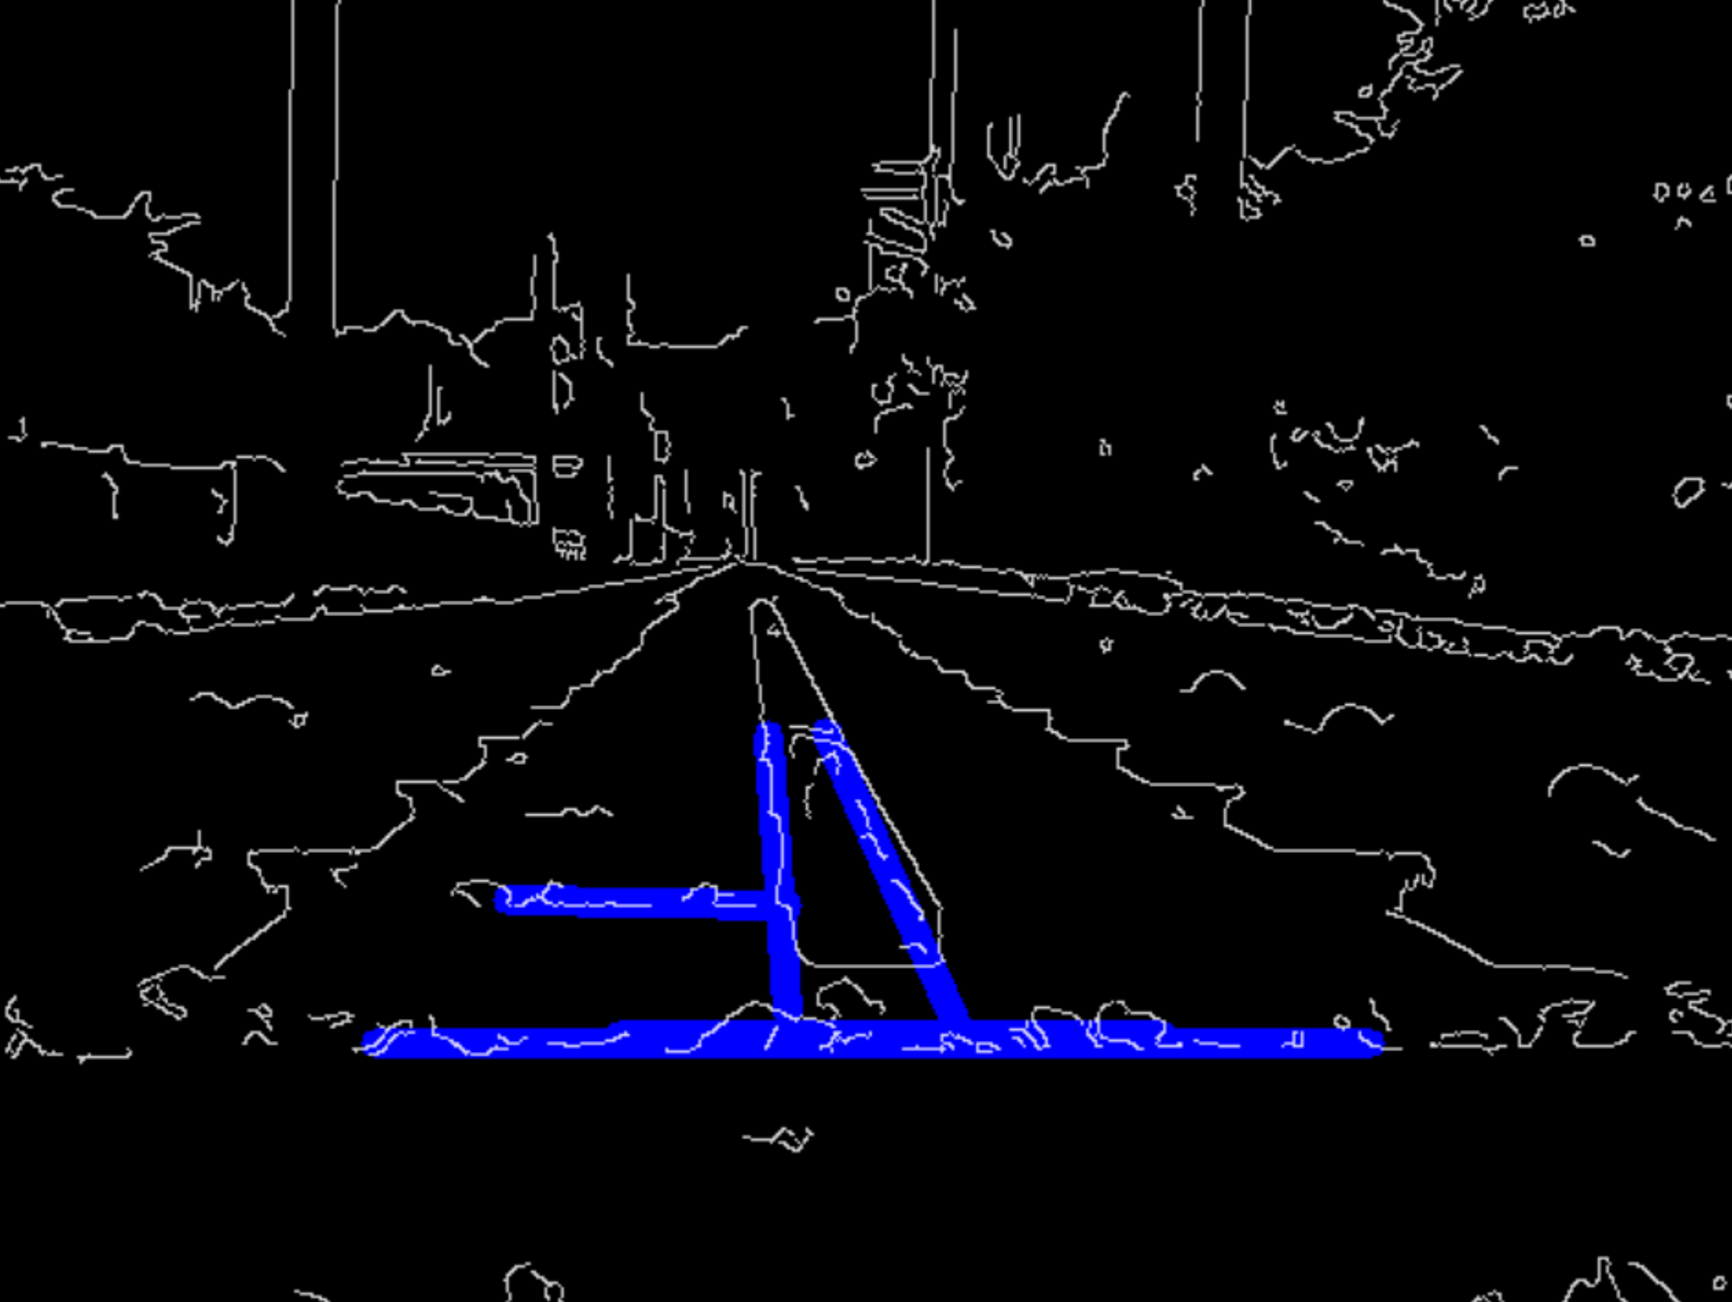
직선 검출을 위해 사용된 OpenCV 기능들은 아래와 같습니다. 로직을 업그레이드하여 여러분만의 로직을 만들어 보세요!
rosbag2 to seperate image
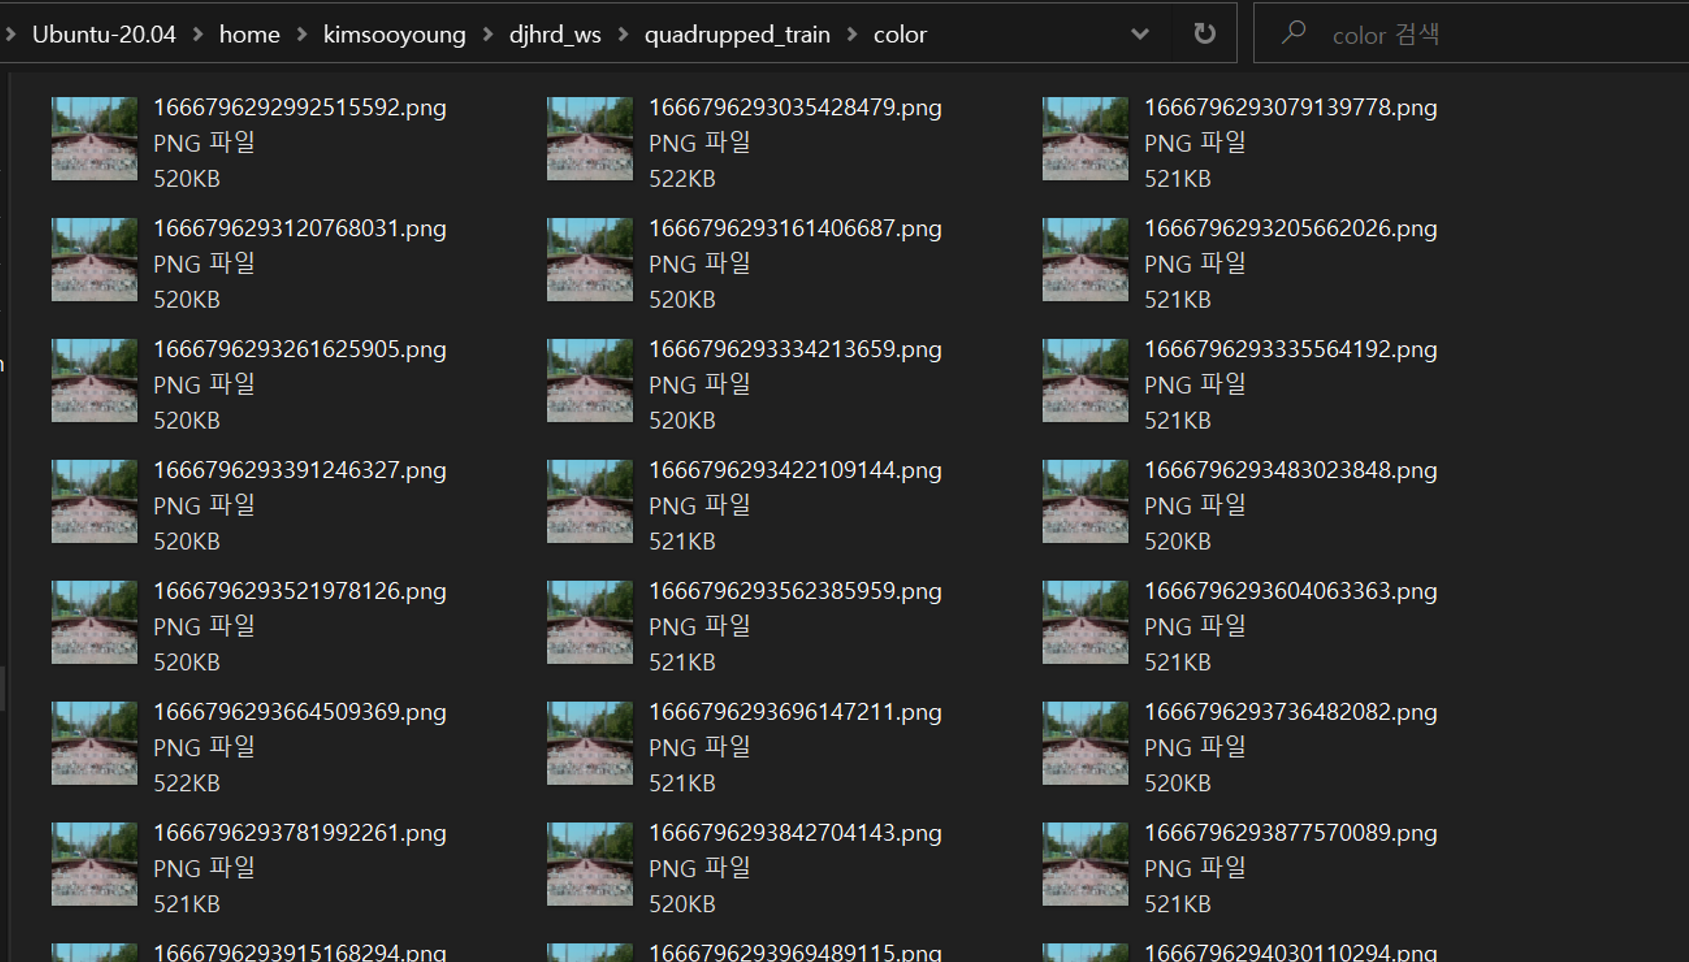
컴퓨터 비전만으로 완벽한 선로 인식을 구현하기는 너무나 힘듭니다. 딥러닝을 사용해서 이를 극복할 수 있을 것이며, 데이터셋의 제작을 위해 rosbag2 데이터에서 이미지를 추출하는 예시를 준비하였습니다.
$ ros2 run py_cv_tutorial rosbag2_to_timedimg
/home/kimsooyoung/ros2_ws/rosbag2/quadrupped_train/quadrupped_train.bag_0.db3
saved: color_1666796292992515592.png
saved: color_1666796293035428479.png
saved: color_1666796293079139778.png
saved: color_1666796293120768031.png
saved: color_1666796293161406687.png
...
- 예제 실행 전 main 함수에서 bag 파일의 위치를 여러분의 것으로 수정해야 합니다.
def main(args=None):

    # Change below roots to your ros2 bag locations
    ROOT_DIR = "/home/kimsooyoung/ros2_ws/rosbag2/quadrupped_train"
    FILENAME = "/quadrupped_train.bag_0.db3"
    DESCRIPTION = "color_"
- 예제 실행 후 사진과 같이 생성된 이미지들이 보인다면 성공입니다. wsl을 사용중이신 분들은 아래와 같이 파일 탐색기를 사용하세요
CV2 and rclcpp
파이썬을 통해 ROS 2와 OpenCV를 연동하는 기본적인 맥락은 이해하셨으리라 생각합니다. 동일한작업을 C++에서 작업하면서 몇가지 유의점을 살펴보겠습니다.
- 코딩을 시작하기 전에, 제가 사용한 opencv 버전을 확인하고 가겠습니다.
$ pkg-config --modversion opencv4
4.2.0
Image Publish - Python
- 이번에 사용되는 파일은 img_pub.cpp이며, 정상 실행을 위해 VIDEO_FILE_ROOT 변수를 여러분의 영상 경로로 수정합니다.
#include "rclcpp/rclcpp.hpp"
#include "std_msgs/msg/header.hpp"
#include "sensor_msgs/msg/image.hpp"

// cv_bridge converts between ROS 2 image messages and OpenCV image representations.
#include <cv_bridge/cv_bridge.h>
// Using image_transport allows us to publish and subscribe to compressed image streams in ROS2
#include <image_transport/image_transport.hpp>
// We include everything about OpenCV as we don't care much about compilation time at the moment.
#include <opencv2/opencv.hpp>

const std::string VIDEO_FILE_ROOT = "/home/kimsooyoung/ros2_ws/go1_lidar.mp4";
- 예시 자체는 python과 동일합니다.
# Terminal 1 - run demo
ros2 run cpp_cv_tutorial img_pub

# Terminal 2 - rqt_image_view
ros2 run rqt_image_view rqt_image_view
- c++에서는 CvImage 객체를 굳이 생성해야 할 필요 없이 toImageMsg를 사용해 변환합니다. 대신 실제 msg로 사용할 때는 get() 함수를 통한 forwarding이 필요합니다.
#include <cv_bridge/cv_bridge.h>
#include <image_transport/image_transport.hpp>
#include <opencv2/opencv.hpp>
...

  void timer_callback() {
    // // Create a new 640x480 image
    // cv::Mat my_image(cv::Size(640, 480), CV_8UC3);

    //--- GRAB AND WRITE LOOP
    cap.read(my_img);
    if (my_img.empty()){
      std::cerr << "ERROR! blank frame grabbed\n";
      rclcpp::shutdown();
    }

    // Write message to be sent. Member function toImageMsg() converts a CvImage
    // into a ROS image message
    img_msg = cv_bridge::CvImage(std_msgs::msg::Header(), "bgr8", my_img).toImageMsg();

    // Publish the image to the topic defined in the publisher
    image_pub->publish(*img_msg.get());
  }
Image Subscribe - Python
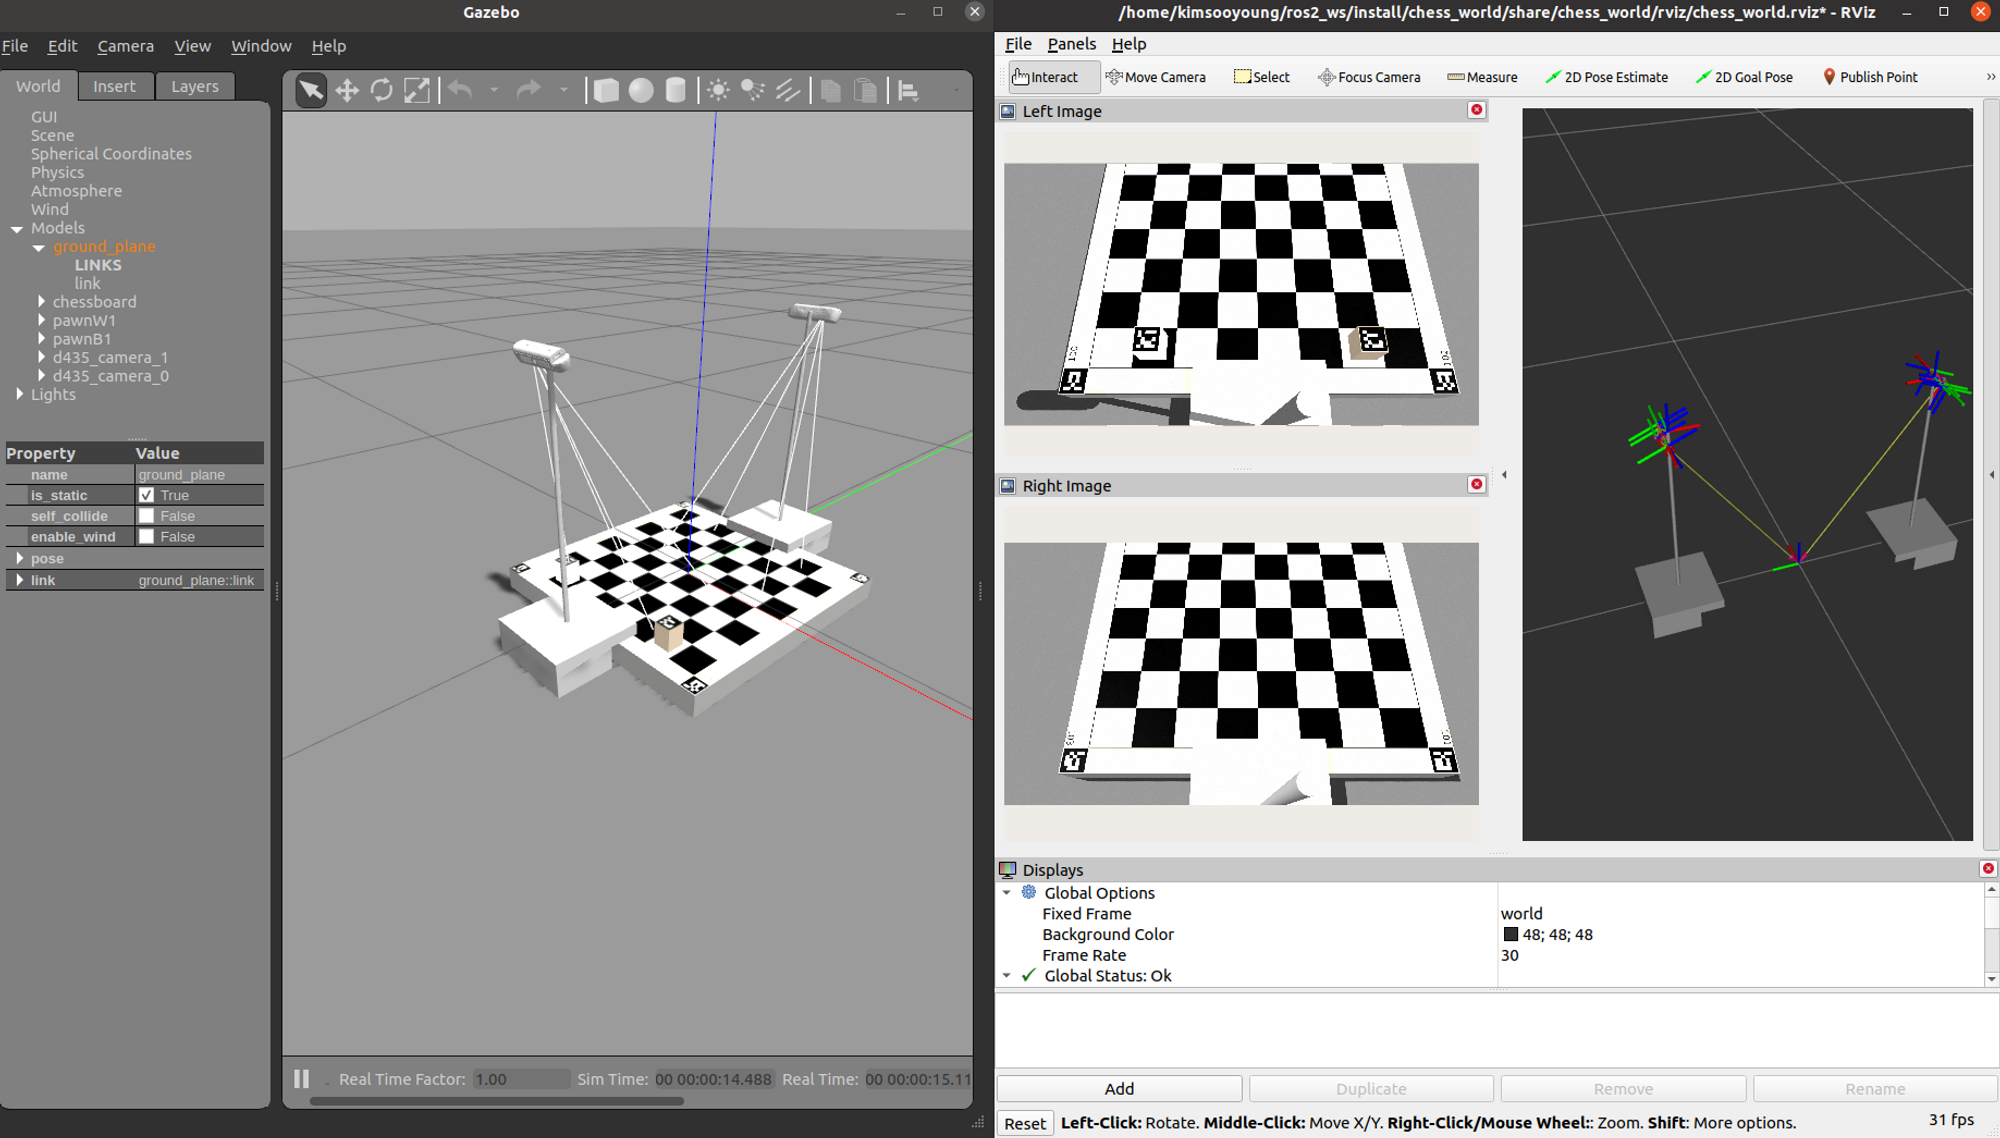
- 예제 실행을 위해 gazebo world를 실행해보겠습니다.
ros2 launch chess_world chess_world.launch.py
- 사용하고 싶은 topic 이름을 img_sub.cpp에 반영한 뒤 예시를 실행합니다.
class ImageSubscriber : public rclcpp::Node{
private:
  rclcpp::Subscription<Image>::SharedPtr m_img_sub;
  rclcpp::Publisher<Image>::SharedPtr m_img_pub;
public:
  ImageSubscriber(): Node("image_subscriber"){

    std::string topic_name = "video_frames";

    m_img_sub = this->create_subscription<Image>(
      topic_name, 10, std::bind(&ImageSubscriber::image_cb, this, std::placeholders::_1)
    );
- 예시 실행 - 아마 단순 이미지 프레임만 반복될 것입니다.
ros2 run cpp_cv_tutorial img_sub
- 이번 예시는 일종의 template 처럼 작성해보았습니다.
- image topic을 받아
- 프로세싱을 거치고
- 이 결과를 화면에 보여주는 예시입니다.
cv::Mat image_processing(const cv::Mat img_in){

  // Create output image
  cv::Mat img_out;
  cv::Mat img_small;
  ...
  return img_out;
}

void image_cb(const Image::SharedPtr msg) const{
  // Convert ROS Image to CV Image
  cv::Mat frame = cv_bridge::toCvCopy(
    msg, sensor_msgs::image_encodings::BGR8
  )->image;

  // Image processing
  cv::Mat proced_img = image_processing(frame);
}
- 현 시스템에서 OpenCV는 CMake의 find_package를 사용할 수 있기 때문에 C++ 예시를 빌드할 때 CMakeLists.txt에서 ament_target_dependencies를 명시합니다.
find_package(OpenCV REQUIRED)

add_executable(img_pub src/img_pub.cpp)
ament_target_dependencies(img_pub rclcpp std_msgs sensor_msgs cv_bridge image_transport OpenCV)

add_executable(img_sub src/img_sub.cpp)
ament_target_dependencies(img_sub rclcpp std_msgs sensor_msgs cv_bridge image_transport OpenCV)
PCL and ROS 2

이번 시간부터 3D PointCloud Data 처리를 위한 다양한 기능을 제공하는 PCL(Point Cloud Library)을 실습하고 ROS 2와 연동해보고자 합니다.
사실 기본적인 PCL에 대한 이해가 있다면 일전 cv2 예시처럼 ROS 2 ⇒ PCL, PCL ⇒ ROS 2의 Mapping 작업만 잘 수행하면 되는데요. 따라서 python, c++에서 pcl을 다루는 방법에 대해 먼저 익숙해진 뒤 ROS 2에서 이를 구현하는 방식으로 진행하겠습니다.
About Point Cloud
- Point Cloud Data는 수많은 3차원 상의 데이터들이 모인 집합체입니다.
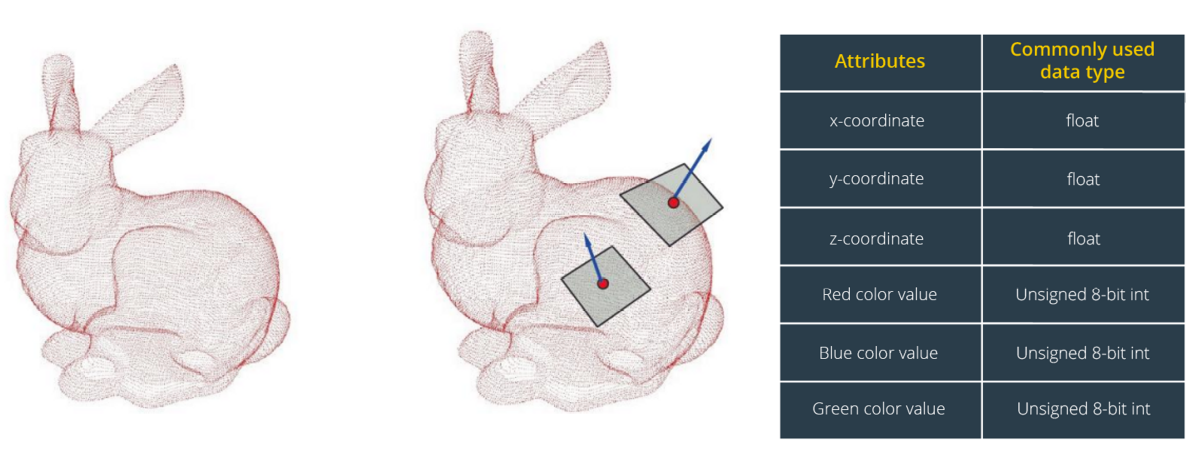
⇒ 하지만 x,y,z를 비롯해서 Point Cloud의 추가 데이터 항목들이 있습니다. 자주 사용되는 point cloud 포멧들을 살펴봅시다.
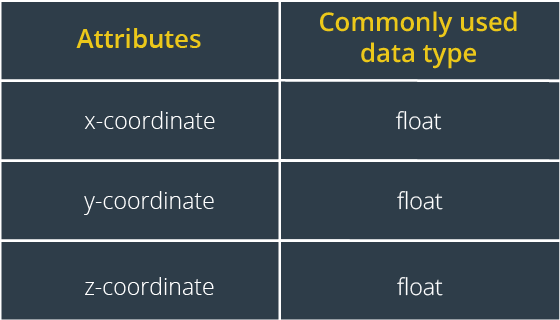
PointXYZ
가장 많이 사용하는 기본 데이터 타입으로 xyz 위치 데이터만 담고 있습니다.
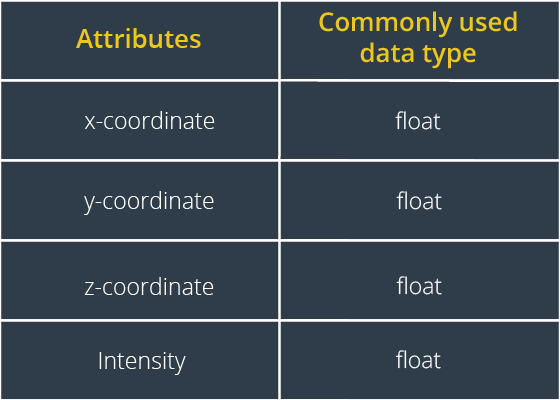
PointXYZI
intensity라는 필드가 추가된 형태로 이는 물체로부터 되돌아온 빛의 양을 뜻합니다. 바닥에 고인 물이나 투명한 물체의 경우 이 I 필드를 통해 detection 가능하여 최근 활발히 연구되고 있습니다.
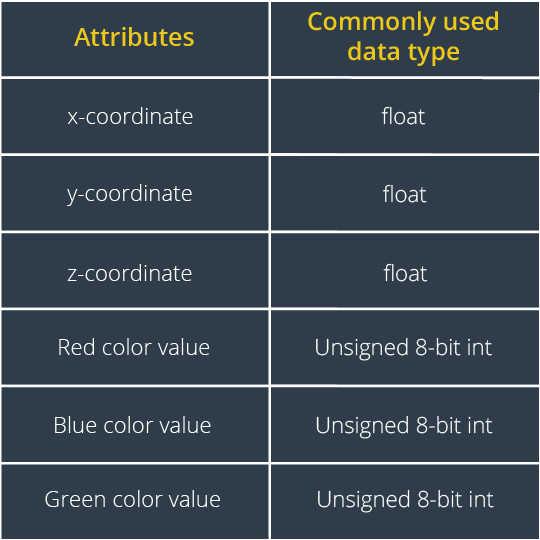
PointXYZRGB
RGB 3색이 포함된 데이터 타입으로 rgbd camera에서 주로 사용됩니다.
PCD Format
Point Cloud는 여러 데이터 포맷으로 사용 가능하지만 가장 자주 사용되는 것은 pcd 포맷입니다. 이는 크게 header/data로 구분되어 있으며 예시를 통해 함께 익숙해져보겠습니다.
| Description | |
|---|---|
| Header | 전체 포인트 수, 데이터 타입, 크기 등의 정보 |
| Data | x,y,z 또는 x,y,z + 추가정보 |
- example - xyzrgb format
# .PCD v0.7 - Point Cloud Data file format
VERSION 0.7
FIELDS x y z rgb
SIZE 4 4 4 4
TYPE F F F U
COUNT 1 1 1 1
WIDTH 4421
HEIGHT 1
VIEWPOINT 0 0 0 1 0 0 0
POINTS 4421
DATA ascii
-0.8739934 -1.342802 0.73930842 1577997
-0.86556709 -1.342802 0.73930842 1577997
-0.85433203 -1.3428019 0.73930848 1577997
-0.84450132 -1.3428019 0.73930854 1577997
- ROS 2에서 사용하는 PointCloud 데이터 포맷은 크게 두가지가 있습니다.
- sensor_msgs/msg/PointCloud
std_msgs/Header header
geometry_msgs/Point32[] points
ChannelFloat32[] channels
- sensor_msgs/msg/PointCloud2
std_msgs/Header header

uint32 height
uint32 width

PointField[] fields

bool    is_bigendian # Is this data bigendian?
uint32  point_step   # Length of a point in bytes
uint32  row_step     # Length of a row in bytes
uint8[] data         # Actual point data, size is (row_step*height)

bool is_dense        # True if there are no invalid points
PointCloud2가 더욱 풍부한 데이터를 담고 있는데요. ROS 2 Foxy 이상부터 PointCloud2를 지원하며 그 이후 버전부터 PointCloud는 거의 사용하지 않습니다.
PCL 설치
PCL c++은 ROS 2 설치 시 자동으로 설치되므로 별도 설치는 필요 없습니다. (오히려 잘못 건들면 복잡해지므로 가만히 냅둡시다.) PCL python은 ubuntu 버전에 따라 설치 방법이 다릅니다.
- ubuntu ≤ 18.04
$ sudo pip install cython
$ sudo apt-get install pcl-tools
$ sudo apt install python3-pcl

$ sudo add-apt-repository ppa:sweptlaser/python3-pcl
$ sudo apt update
$ sudo apt install python3-pcl
- ubuntu ≥ 20.04
$ sudo apt install python3-pcl
- 설치가 잘 되었는지 확인해봅시다.
$ python3
Python 3.8.10
[GCC 9.4.0] on linux
Type "help", "copyright", "credits" or "license" for more information.
>>> import pcl
>>>
PCL python
아래 표와 같이 pcl은 다양한 알고리즘을 API 형태로 제공하고 있습니다. 이들에 익숙해지기 위해 python pcl을 사용하여 실습을 해본 뒤, 실제 ROS 2 topic을 처리해보고, c++로도 사용해보겠습니다.
| Fuction | Description |
|---|---|
| pcl_visualization | PointCloud 시각화 도구 |
| pcl_surface | 3차원 곡면 복원 |
| pcl_segmentation | PointCloud의 Clustering과 Classification 기능 |
| pcl_sample_consensus | 선, 평면, 실린더 등 모델 추정을 위한 알고리즘 |
| pcl_kdtree | 빠른 처리, 탐색을 위한 자료 구조 |
| pcl_features | PointCloud로부터 특징 추출을 위한 자료 구조와 방법들 |
| pcl_registration | ICP와 같이 서로 다른 PointCloud를 Align하고 정합하기 위한 방법들 |
| pcl_keypoints | Key point 검출 알고리즘 (BRISK, Harris Corner, NARF, SIFT, SUSAN 등) |
| pcl_io 3D | 센서로부터 PointCloud 데이터를 직접 읽고 쓰기 위한 인터페이스 |
PCL IO
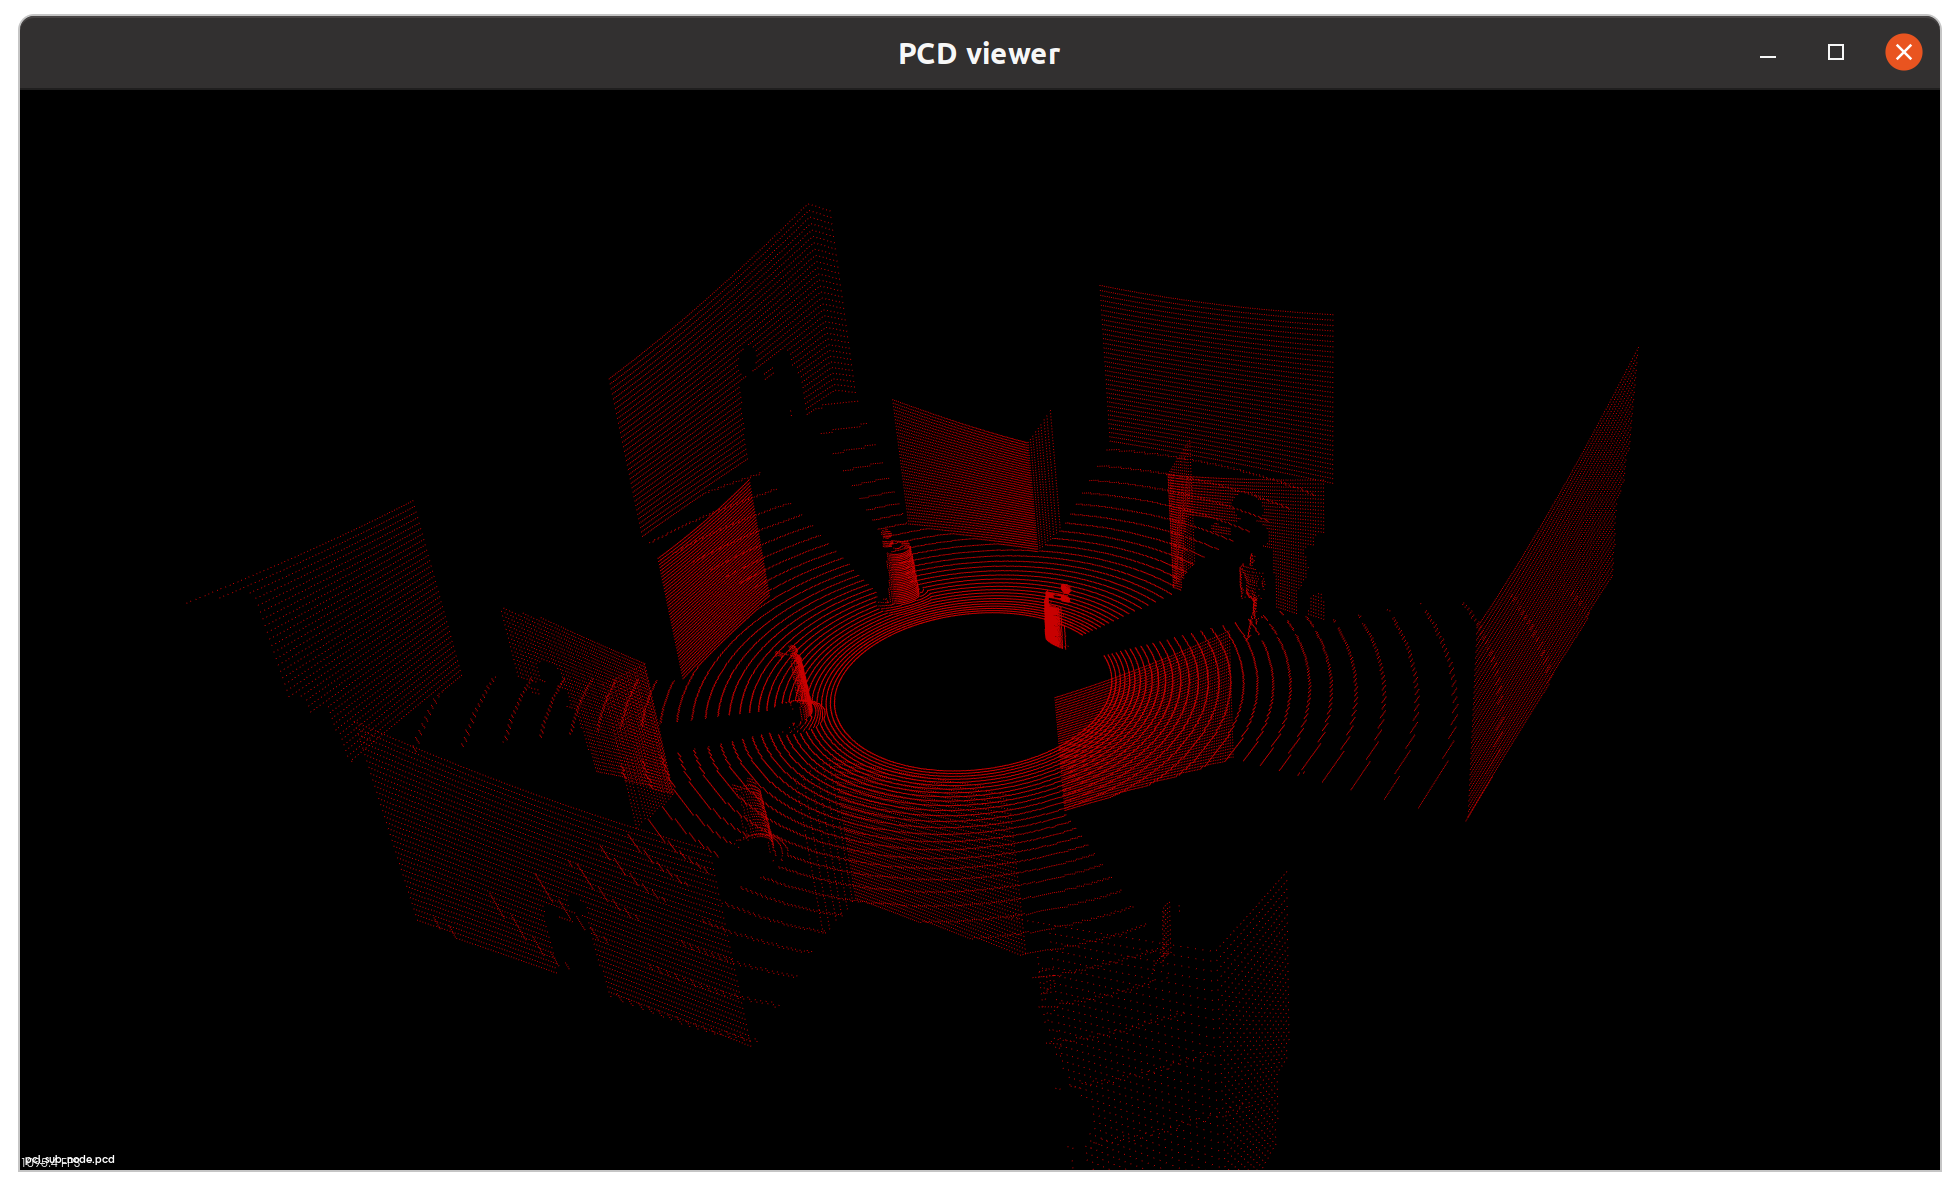
- pcd 포멧의 point cloud 데이터를 읽고, 저장하고, 시각화하는 방법은 아래와 같습니다.
cd py_pcl_tutorial/exercise
python3 example1_load_and_view.py
- example1_load_and_view.py
import pcl
import pcl.pcl_visualization

# Load point cloud file
cloud = pcl.load_XYZRGB('./data/pcl_sub_node.pcd')

# Create pcl built-in viewer
visual = pcl.pcl_visualization.CloudViewing()

##### Visualize APIs #####
# 'ShowColorACloud',
# 'ShowColorCloud',
# 'ShowGrayCloud',
# 'ShowMonochromeCloud',
# 'WasStopped'

filename = 'example_save.pcd'
pcl.save(cloud, filename)

visual.ShowColorCloud(cloud, b'cloud')
v = True
while v:
    v = not(visual.WasStopped())
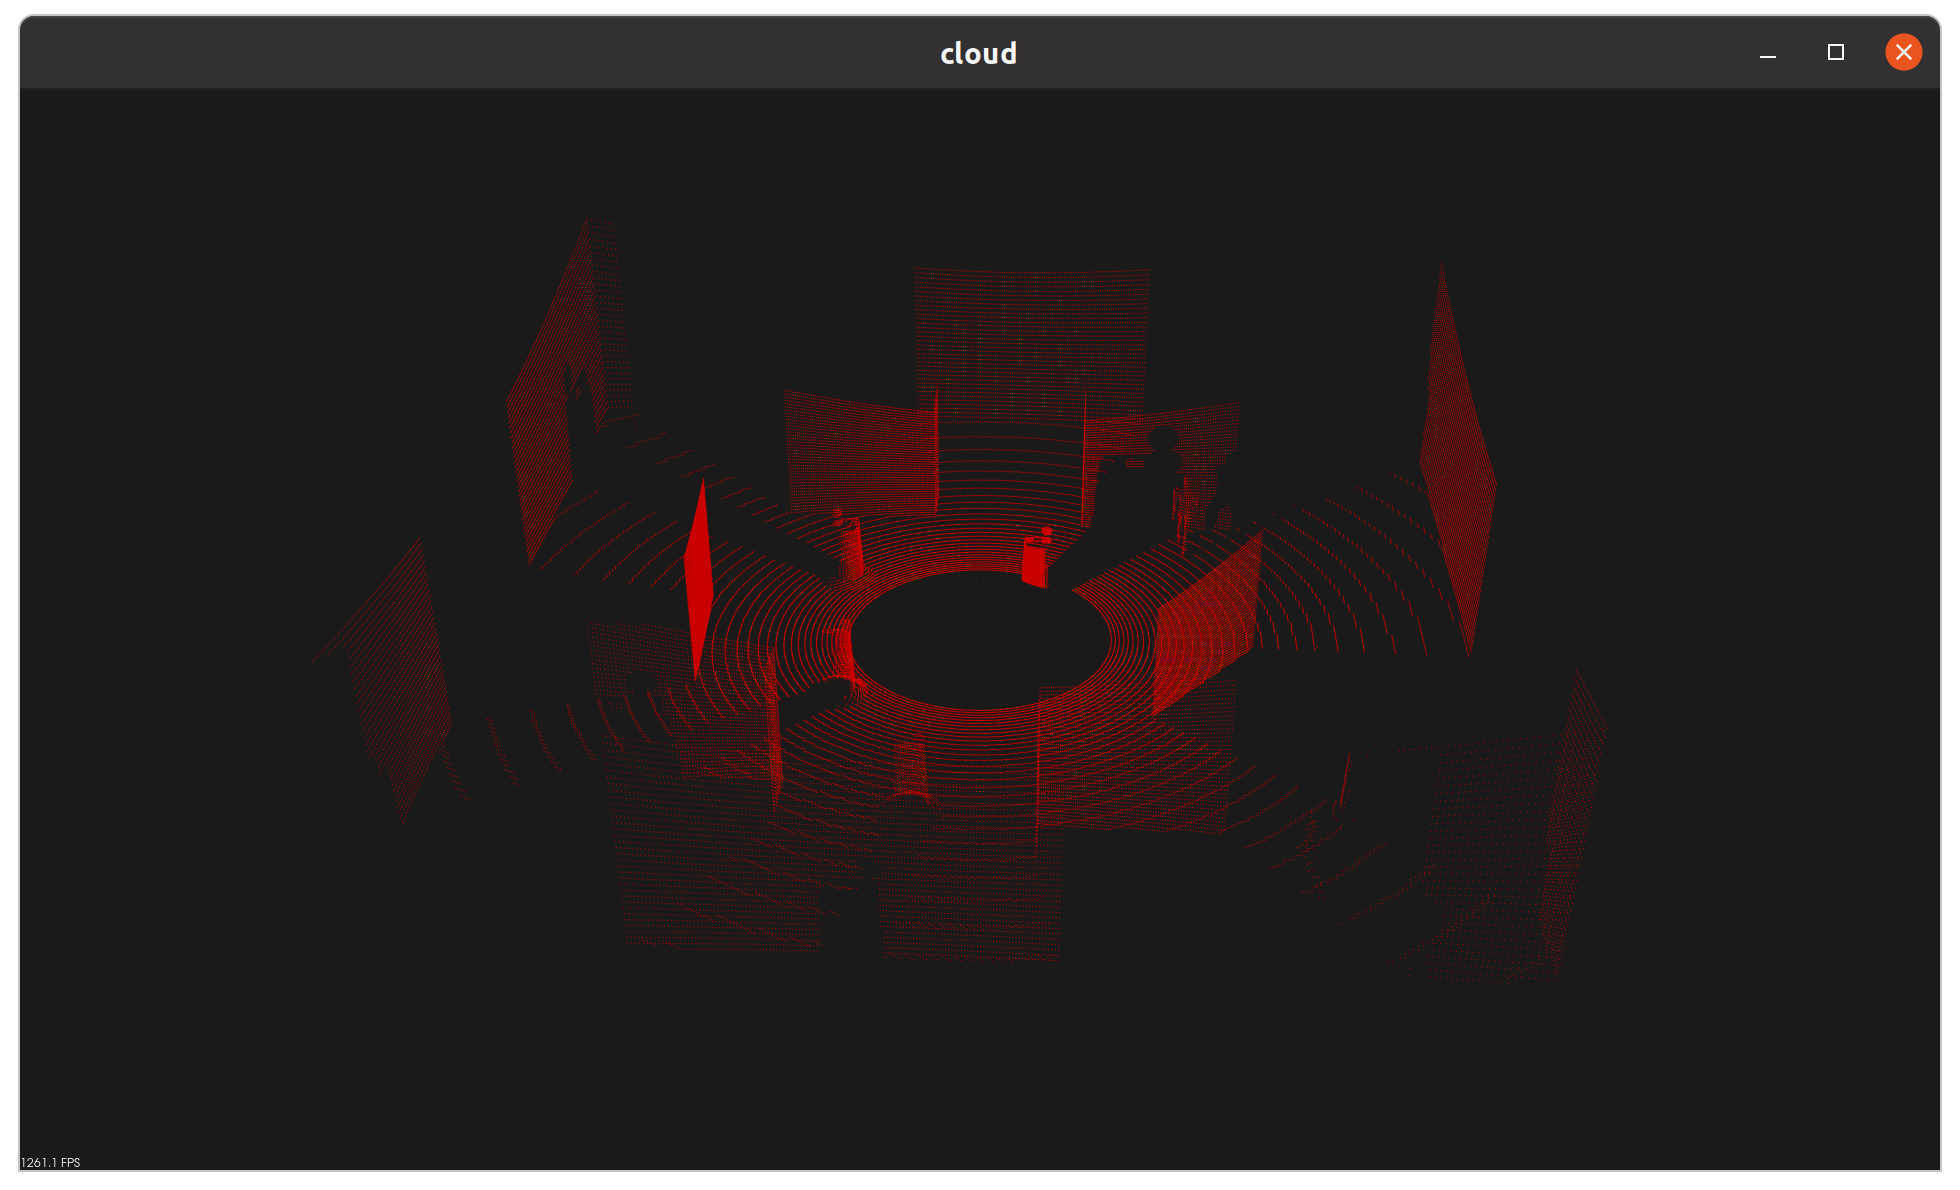
pcl_sub_node.pcd는 lidar world에서 제가 미리 추출해 둔 pointcloud 입니다.
| Description | |
|---|---|
| pcl.load_XYZRGB() | pcd data를 load합니다. 단, 저장된 유형에 따라 load_XYZ, load_XYZI 등 사용하는 함수가 다릅니다. |
| pcl.pcl_visualization.CloudViewing() | 시각화를 위한 뷰어를 생성합니다. |
| pcl.save(, ) | 처리한 cloud를 저장합니다. |
Voxel Grid Sampling
수많은 point cloud들을 모두 각각 처리하는 것은 매우 많은 연산을 요합니다. 따라서 보통 이를 3차원 격자의 Voxel 형태로 Sampling 합니다. Voxel이란, 마치 게임 그래픽처럼 해상도를 낮춘 큐브이며 Voxel 내 점 군 유/무에 따라 중심점을 샘플링합니다.

- example2_voxelgrid.py
# Voxel Grid filter
# Create a VoxelGrid filter object for our input point cloud
vox = cloud.make_voxel_grid_filter()

# Choose a voxel (also known as leaf) size
# Note: this (1) is a poor choice of leaf size
# Experiment and find the appropriate size!
LEAF_SIZE = 0.01

# Set the voxel (or leaf) size
vox.set_leaf_size(LEAF_SIZE, LEAF_SIZE, LEAF_SIZE)

# Call the filter function to obtain the resultant downsampled point cloud
cloud_voxed = vox.filter()
LEAF_SIZE = 0.01
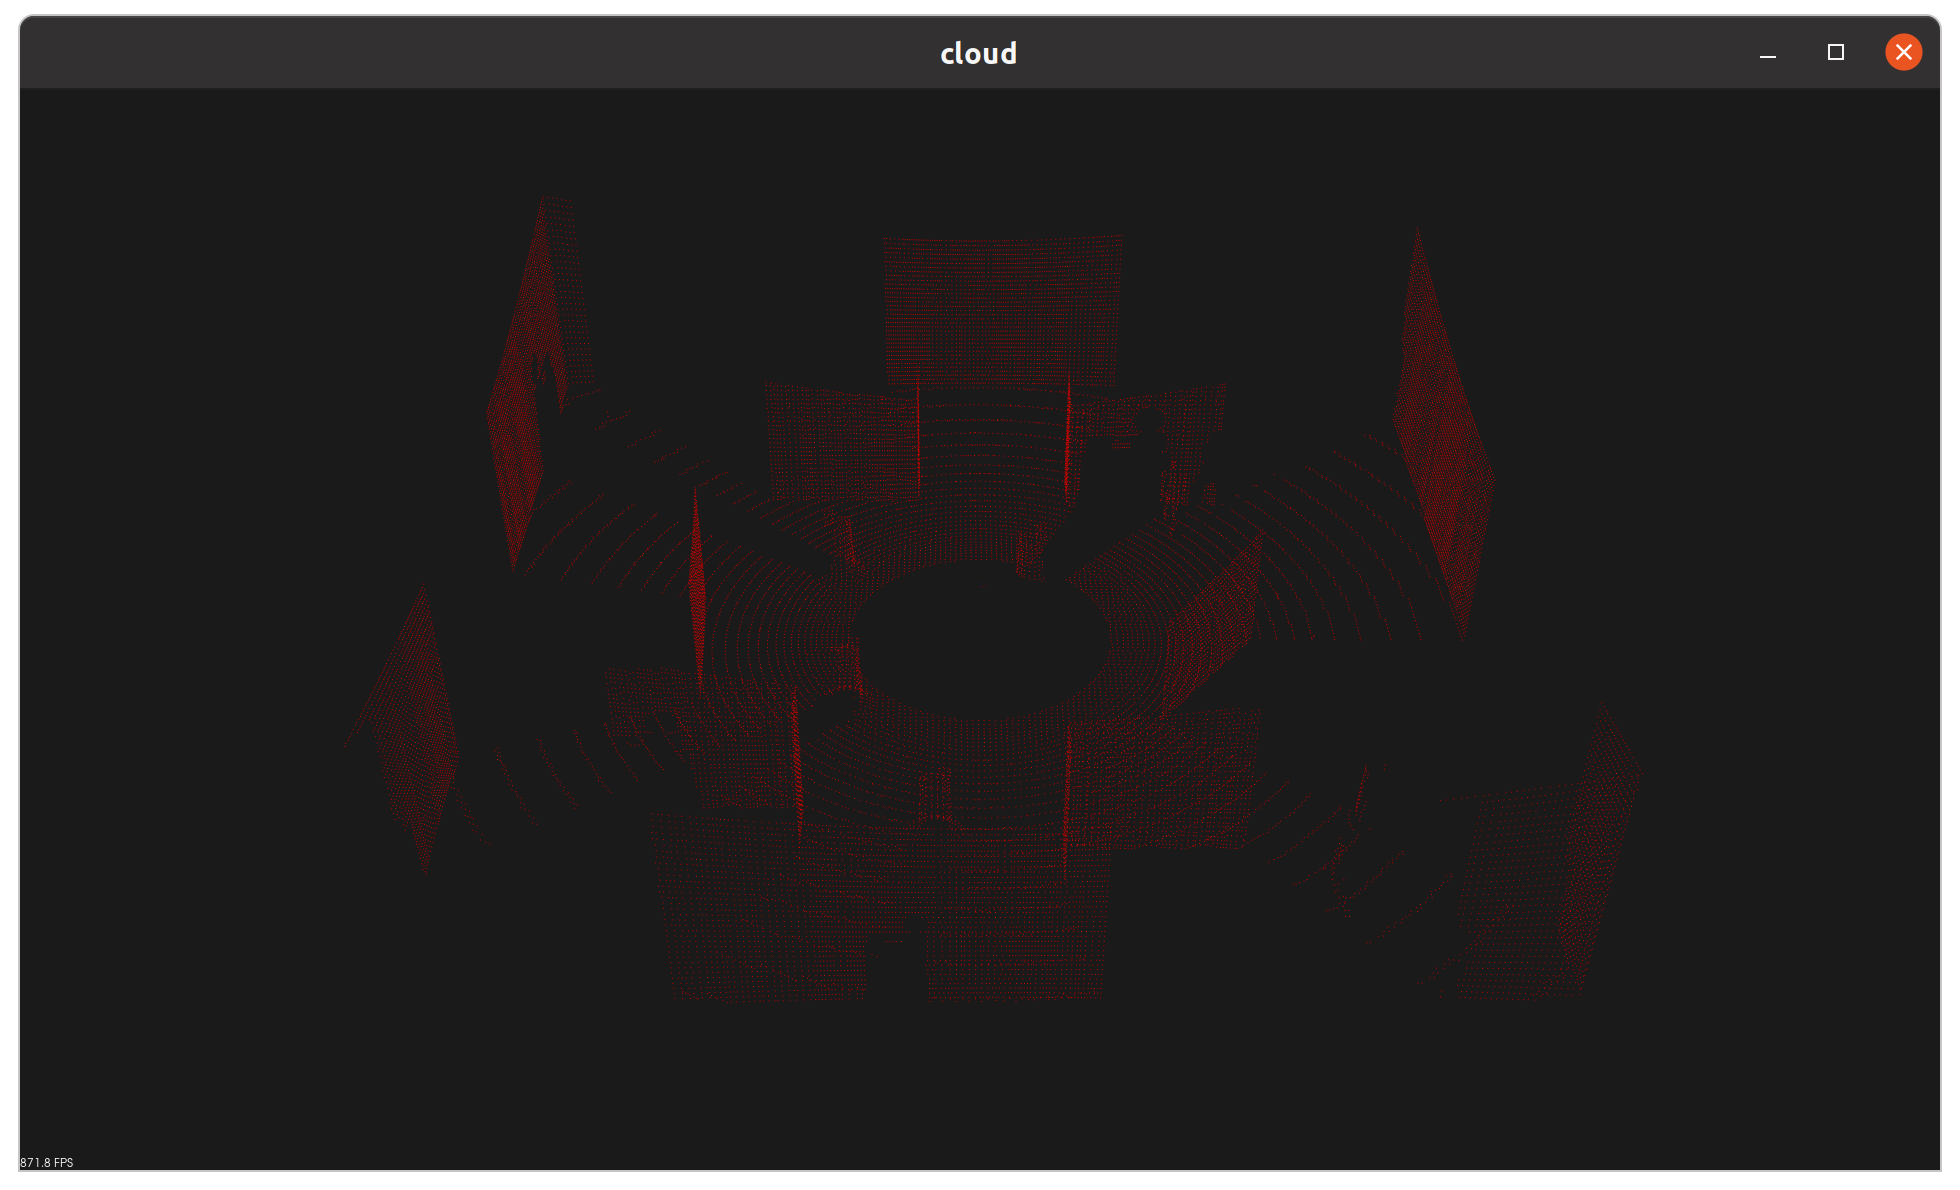
LEAF_SIZE = 0.1
Pass Through Filter
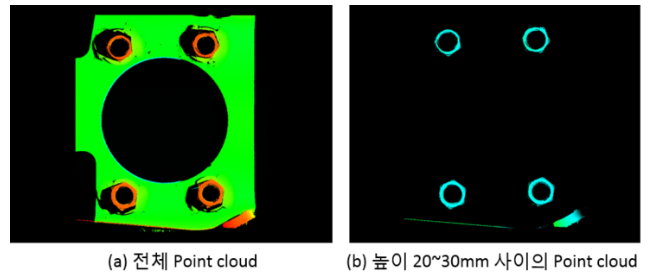
ROI(Region of Interest)를 설정하고 원하는 위치의 point cloud들만 추려내보겠습니다. 주로 바닥 지점이나, 테이블 위 물체에서 물체 부분만 추출하는 경우 사용됩니다.
- example3_roi_filter.py
# Pass Through filter
passthrough = cloud_voxed.make_passthrough_filter()

# Assign axis and range to the passthrough filter object.
filter_axis = 'z'
passthrough.set_filter_field_name(filter_axis)
axis_min = -1.1
axis_max = 1.1
passthrough.set_filter_limits(axis_min, axis_max)

cloud_filtered = passthrough.filter()
⇒ 현재 z축을 기준으로 -1.1 ~ 1.1 영역을 필터링하였습니다. x y 축에 대해서도 동일 작업이 가능합니다.
RANSAC Plane Fitting
직선은 2개의 매개변수로, 평면은 3개의 매개변수로 모델링할 수 있습니다. PCL에서는 이런 모델 기반 Consensus를 사용하는 가장 대표적인 예시인 RANSAC을 제공하고 있습니다.
- Model Hypothesis를 통해 매개변수를 구했다면, 해당 모델에 포함되는 inlier와 outlier를 추출할 수 있게 됩니다. 이때 inlier의 임계값으로 허용하는 최대 거리가 max_distance입니다.
- seg.segment()를 통해 도출한 inlier index 들로 기존 point cloud에서 inliner/outlier들을 추출할 수 있습니다. negative=True ⇒ outlier extraction negative=False ⇒ inlier extraction
# RANSAC plane segmentation
# Create the segmentation object
seg = cloud_filtered.make_segmenter()

# Set the model you wish to fit
seg.set_model_type(pcl.SACMODEL_PLANE)
seg.set_method_type(pcl.SAC_RANSAC)

# Max distance for a point to be considered fitting the model
# Experiment with different values for max_distance
# for segmenting the table
max_distance = 0.01
seg.set_distance_threshold(max_distance)

# Call the segment function to obtain set of inlier indices and model coefficients
inliers, coefficients = seg.segment()

# Extract inliers
extracted_inliers = cloud_filtered.extract(inliers, negative=True)
목적 자체는 바닥을 제거한다는 점에서 Pass Through Filter와 동일하지만, 사용되는 알고리즘에서 차이를 갖습니다.
Statistical Outlier Removal Filter
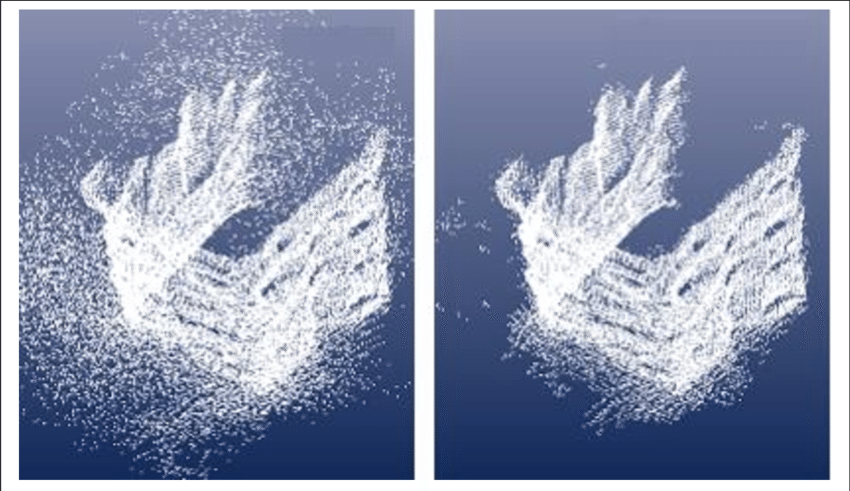
실제 센서를 사용하다보면 사진과 같이 노이즈도 심하고, 의도치 않는 비정상적인 이상치가 발생합니다. PCL에서는 일종의 평균 필터를 통해 이를 제거하는 함수를 갖고 있습니다.
# Much like the previous filters, we start by creating a filter object:
outlier_filter = cloud_filtered.make_statistical_outlier_filter()

# Set the number of neighboring points to analyze for any given point
outlier_filter.set_mean_k(50)

# Set threshold scale factor
x = 1.0

# Any point with a mean distance larger than global (mean distance+x*std_dev) will be considered outlier
outlier_filter.set_std_dev_mul_thresh(x)

# Finally call the filter function for magic
cloud_filtered = outlier_filter.filter()
⇒ 현재 우리 예시는 Gazebo에서 추출한지라 이 필터의 영향이 거의 없습니다. 따라서 예제 코드는 생략하겠습니다.
KD-Tree Search
KD-Tree는 Binary Tree를 응용한 K 차원의 자료 구조입니다. x,y,z 3차원에 대한 KD-Tree를 구축하고, 이 안에 모든 point들을 가지런히 추가해두면, 이후 거리 계산 등 연산 시 매우 빠른 탐색이 가능합니다.
# create kd tree for the search method of extraction
tree = extracted_inliers.make_kdtree()
⇒ XYZRGB 데이터는 make_kdtree_flann()이라는 함수를 사용합니다.
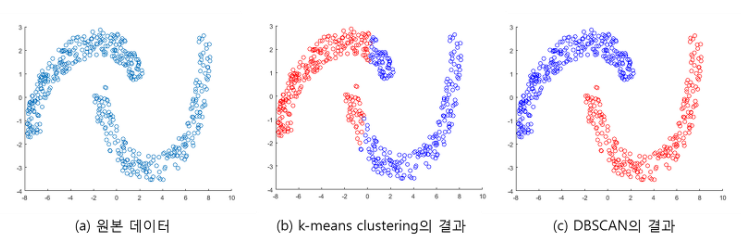
Euclidean Clustering (DBSCAN)
Point Cloud들을 분류하여 군집화를 해야 물체 인식과 추정이 가능합니다. 군집과 알고리즘에는 여러 종류가 있지만 이번 실습에서는 밀집도를 기준으로 분류하는 Euclidean Clustering을 사용하겠습니다.
이 방식은 클러스터 수를 지정하지 않아도 알아서 클러스터 수도 결정하고, 불특정한 형상의 클러스터도 분류할 수 있습니다. 뿐만 아니라 노이즈에도 강인한 알고리즘입니다.
- example5_clustering.py
# Load point cloud file
cloud = pcl.load_XYZRGB('./data/pcl_sub_node.pcd')

# eliminate color from cloud for clustering
while_cloud = XYZRGB_to_XYZ(cloud)
...

# Create a cluster extraction object
ec = extracted_inliers.make_EuclideanClusterExtraction()

# Set tolerances for distance threshold
# as well as minimum and maximum cluster size (in points)
ec.set_ClusterTolerance(0.07)
ec.set_MinClusterSize(10)
ec.set_MaxClusterSize(25000)

# Search the k-d tree for clusters
ec.set_SearchMethod(tree)

# Extract indices for each of the discovered clusters
cluster_indices = ec.Extract()

# Create Cluster-Mask Point Cloud to visualize each cluster separately
get_color_list.color_list =[]
cluster_color = get_color_list(len(cluster_indices))

# Assign a color corresponding to each segmented object in scene
color_cluster_point_list = []

for j, indices in enumerate(cluster_indices):
    for i, indice in enumerate(indices):
        color_cluster_point_list.append([extracted_inliers[indice][0],
                                        extracted_inliers[indice][1],
                                        extracted_inliers[indice][2],
                                        rgb_to_float(cluster_color[j])])

#Create new cloud containing all clusters, each with unique color
cluster_cloud = pcl.PointCloud_PointXYZRGB()
cluster_cloud.from_list(color_cluster_point_list)
- 이전 예시와 달리, clustering을 위해 필요없는 색상 데이터는 제거하였습니다.
# Load point cloud file
cloud = pcl.load_XYZRGB('./data/pcl_sub_node.pcd')

# eliminate color from cloud for clustering
while_cloud = XYZRGB_to_XYZ(cloud)
- make_EuclideanClusterExtraction()을 통해 filter를 구성하고 매개변수를 설정합니다.
# Create a cluster extraction object
ec = extracted_inliers.make_EuclideanClusterExtraction()

# Set tolerances for distance threshold
# as well as minimum and maximum cluster size (in points)
ec.set_ClusterTolerance(0.07)
ec.set_MinClusterSize(10)
ec.set_MaxClusterSize(25000)
| Description | |
|---|---|
| set_ClusterTolerance | point clout 처리 시 cluster로 판단하는 기준 거리 |
| set_MinClusterSize | cluster가 되기 위한 최소 point cloud 개수 |
| set_MaxClusterSize | cluster가 되기 위한 최대 point cloud 개수 |
- cluster를 판단하기 위해 거리계산이 필요하며, 이는 일전 생성한 KD tree를 사용합니다.
ec.set_SearchMethod(tree)
- clustering의 결과는 point cloud set이 아니라 cluster와 이에 해당하는 point들의 index입니다. 따라서 extract 이후 별도의 후처리 과정이 필요합니다. 현재는 서로 다른 cluster 마다 색상을 부여하여 시각화하고 있습니다.
# Extract indices for each of the discovered clusters
cluster_indices = ec.Extract()

# Create Cluster-Mask Point Cloud to visualize each cluster separately
get_color_list.color_list =[]
cluster_color = get_color_list(len(cluster_indices))

# Assign a color corresponding to each segmented object in scene
color_cluster_point_list = []

for j, indices in enumerate(cluster_indices):
    for i, indice in enumerate(indices):
        color_cluster_point_list.append([extracted_inliers[indice][0],
                                        extracted_inliers[indice][1],
                                        extracted_inliers[indice][2],
                                        rgb_to_float(cluster_color[j])])
PCL python ROS 2 연동
지금까지 배운 내용들을 총동원해서 PCL를 ROS 2와 연동해보겠습니다.
- 예시 실행
# Terminal 1 - gazebo world launch
ros2 launch lidar_world lidar_world.launch.py

# Terminal 2 - python node run
ros2 run py_pcl_tutorial pcl_cluster_pub
[INFO] [1682602819.908146533] [pcl_cluster_node]: PCL Cluster Node has been started
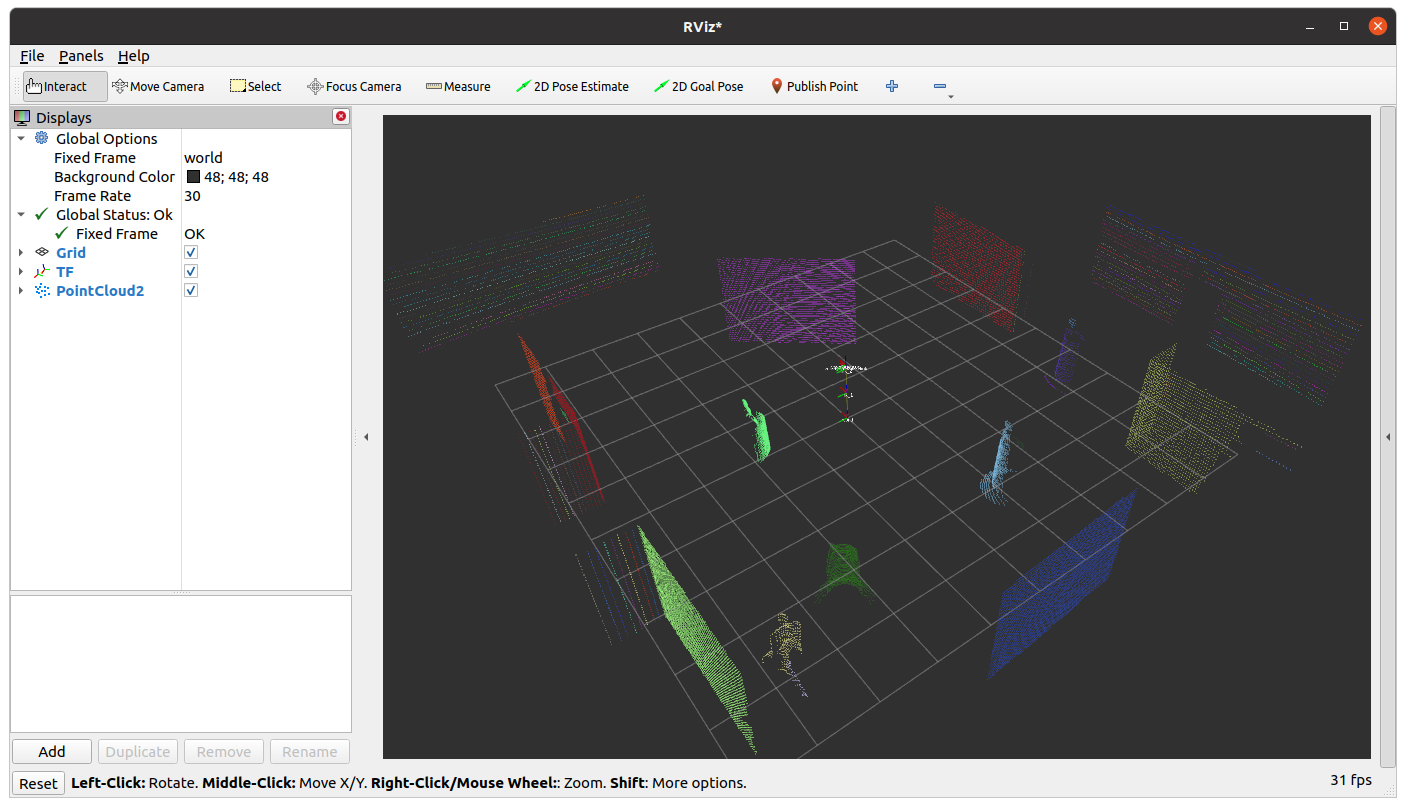
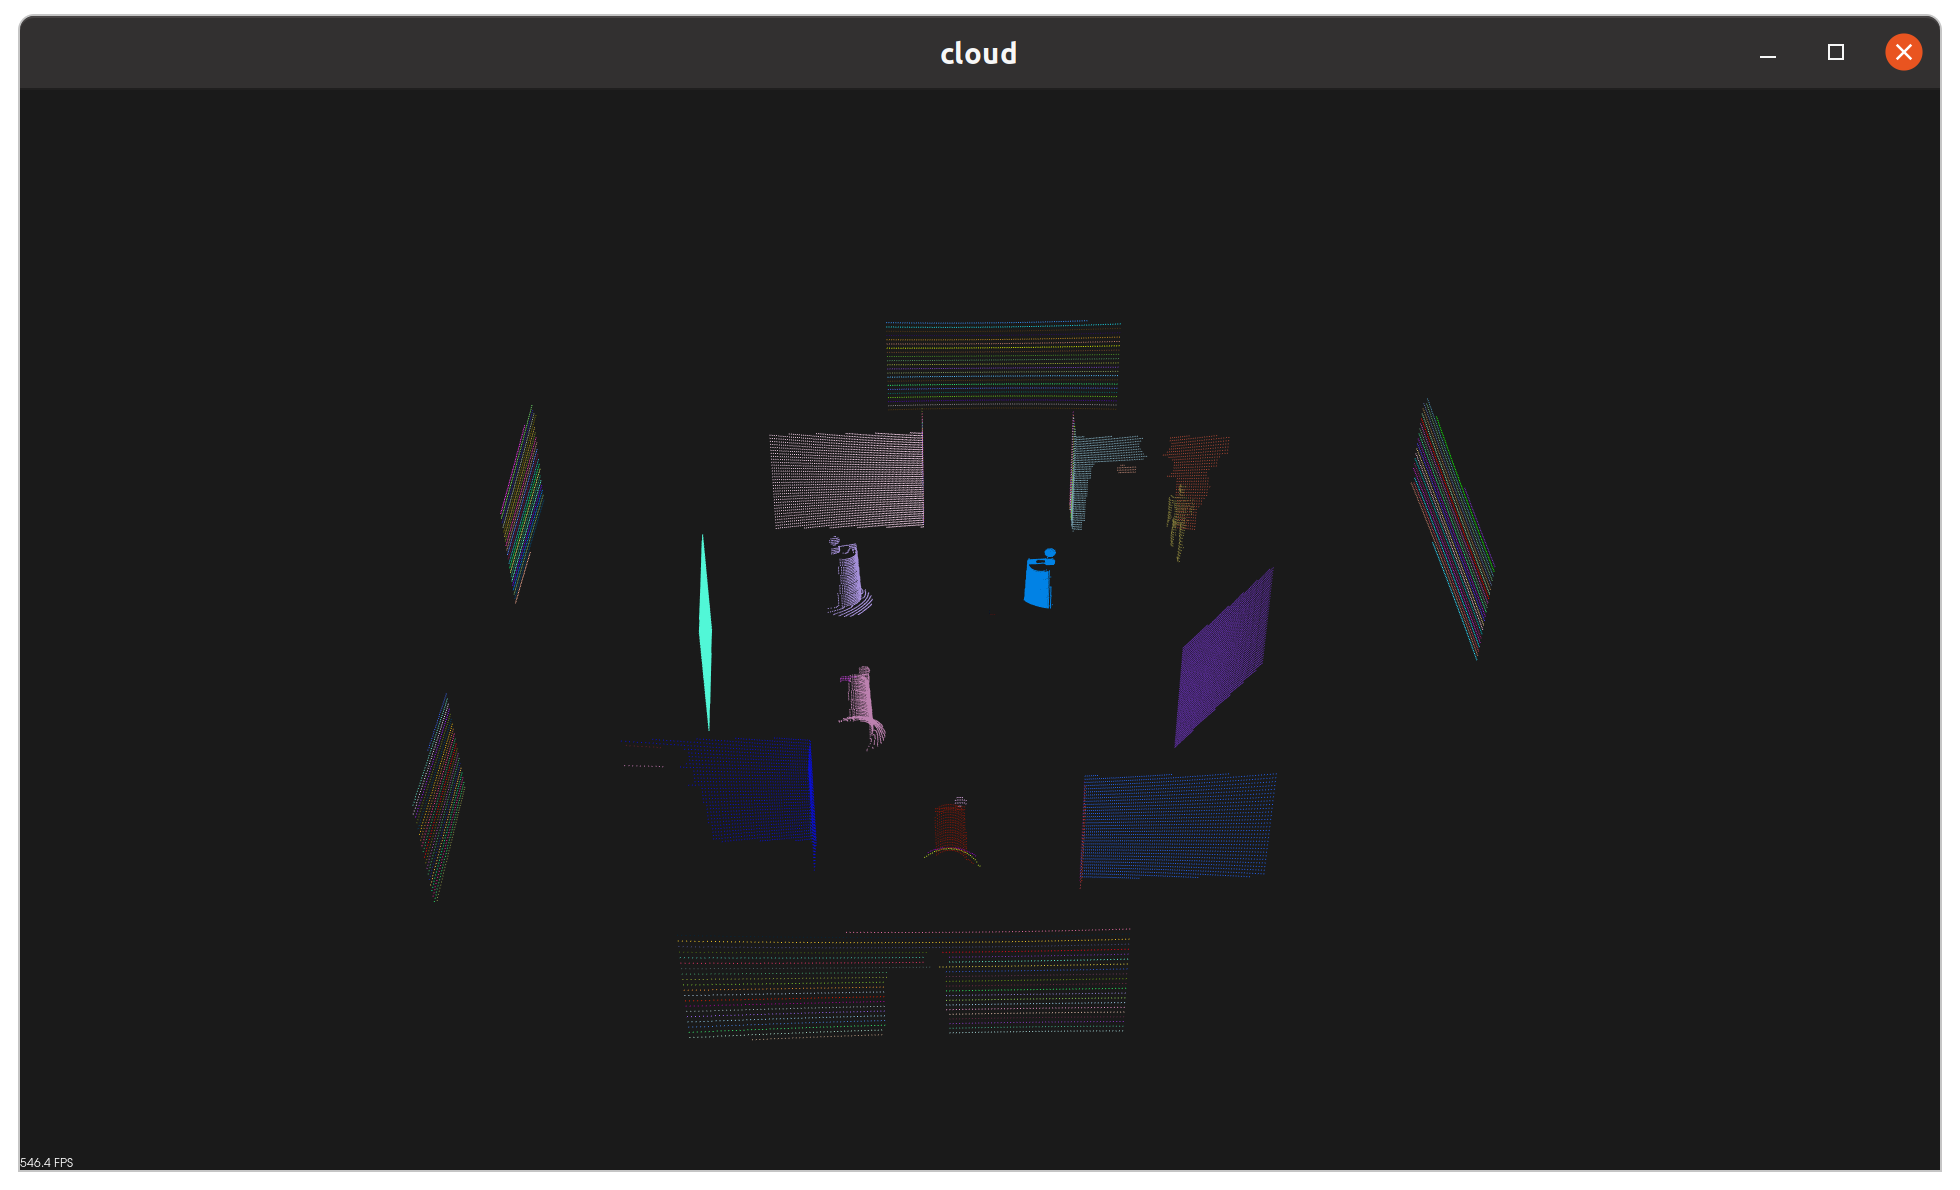
rviz2를 통해 /cluster topic을 subscribe 하면, 사진과 같이 물체별로 다른 색상이 적용된 새로운 pointcloud topic을 확인할 수 있습니다.
코드를 분석하기 전, 전체 시스템을 요약해보았습니다.
- ROS 2의 PointCloud2 msg를 PCL 타입으로 변환합니다.
- PCL data와 일전 예시 코드를 통해 clustering을 구현합니다.
- 분리한 cluster들에 개별 색상을 부여하고, 다시 ROS 2 PointCloud2 타입으로 변환합니다.
- topic publish!
- ROS 2 ⇒ PCL / PCL ⇒ ROS 2 사이의 변환은 pcl_helper라는 별도 코드를 구현해 두었습니다.
def ros2_to_pcl(ros_cloud):
    """ Converts a ROS PointCloud2 message to a pcl PointXYZRGB

        Args:
            ros_cloud (PointCloud2): ROS PointCloud2 message

        Returns:
            pcl.PointCloud_PointXYZRGB: PCL XYZRGB point cloud
    """
    ...

def pcl_to_ros2(pcl_array, now=None):
    """ Converts a pcl PointXYZRGB to a ROS PointCloud2 message

        Args:
            pcl_array (PointCloud_PointXYZRGB): A PCL XYZRGB point cloud
            now (Time): A ROS 2 time object like self.get_clock().now()

        Returns:
            PointCloud2: A ROS point cloud
    """
주의해야 할 점으로, PCL ⇒ ROS 2 변환 시에는 시간에 대한 데이터가 추가되니 Node 내부의 clock에서 now 객체를 전달해야 합니다.
- PCLClusterNode의 생성자에서 subscriber와 publisher를 하나씩 생성합니다.
class PCLClusterNode(Node):

    def __init__(self):
        super().__init__('pcl_cluster_node')

        self.pc_subscription = self.create_subscription(
            PointCloud2, 'pointcloud',
            self.pcl_callback, 10
        )

        self.cluster_publisher = self.create_publisher(
            PointCloud2, 'cluster', 10
        )
- subscription callback에서 대부분의 로직이 구현되어 있습니다.
    def pcl_callback(self, pcl_msg):

        # TODO: Convert ROS msg to PCL data
        pcl_data = ros2_to_pcl(pcl_msg)
        ...

        #Create new cloud containing all clusters, each with unique color
        cluster_cloud = pcl.PointCloud_PointXYZRGB()
        cluster_cloud.from_list(color_cluster_point_list)
        ...
- callback의 마지막에 pcl_to_ros2를 통해 전체 cluster를 PointCloud2 타입으로 변환한 뒤 publish합니다.
    # Convert PCL data to ROS 2 messages
    cluster_cloud_msg = pcl_to_ros2(cluster_cloud, now=self.get_clock().now())
    self.cluster_publisher.publish(cluster_cloud_msg)